Location Drawer Variances Report
Location Drawer Variances Report
The Location Drawer Variances Report lists variances by locations and employees, detailing the number of transactions and lowest/highest/average variance values.
In this article, you will learn:
- How to Generate the "Location Drawer Variances Report"
- How to Apply Various Report Filters
1. Reaching the "Location Drawer Variances Report"
To reach the "Location Drawer Variances Report," follow the below steps:
- Step 1: Log into Control Center
- Step 2: Choose Point of Sale
- Step 3: Choose Reports
- Step 4: Choose Smart Till Reports
- Step 5: Choose Location Drawer Variances Report
See Figure 1.1. You will see the different Smart Till Reports that are available. By clicking the "Choose Report" drop-down selection, you will see the different types of Smart Till Reports.
Figure 1.1
By clicking "Location Drawer Variances Report," you will be redirected to the Location Drawer Variances Report" page with relevant filtering and sorting options.
2. Generating the "Location Drawer Variances Report"
When you navigate to the "Location Drawer Variances Report" page, you will get the options pre-selected by default. You can generate the "Location Drawer Variances Report" by clicking the "Generate Report" button.
Figure 2.0
Fields:
- Location: This column displays the name of the store location.
- Employee Name: The name of the cashier responsible for the shift(s) being looked at.
- # of Transactions: This column displays the total number of transactions that happened at that store location in the selected date range.
- # of Variance Transactions: This column displays the number of transactions with variance.
- Lowest Variance: This column displays the lowest variance amount found among all the transactions that happened at that store location in the selected date range.
- Lowest Variance Transaction Amount: This column displays the transaction amount with the lowest variance.
- Avg Variance: The average variance is calculated by the system based on the total variance amount divided by the number of transactions with a variance in the selected date range.
- Highest Variance: This column displays the highest variance amount found among all the transactions that happened at that store location in the selected date range.
- Highest Variance Transaction Amount: This column displays the transaction amount with the highest variance.

If you wish to know more about the Lowest Variance Transaction Amount and Highest Variance Transaction Amount, you can click on the amount value highlighted in blue.
Figure 2.1
Figure 2.2
3. Filter Employees
With this, the report will be displayed as per the selected cashier's name.
- Filter by Cashier: This option allows you to choose a specific cashier to generate filter specific report.
Figure 3.0
By clicking the "Manage" button, a "Manage Filters" window will pop up. You will see the following details.
Figure 3.1
- You will see different records to select the items for the Location Drawer Variances Report.
- You will find the checkbox along with all the records. You need to select the items from the list and move them to the Selected List area on the right side.
- Once you select the records from the list, click on the green right-sided arrow ("Move/Next" button) to move the records to Selected List.
- By clicking the Move button, the selected records will be moved to Selected List. So, the Location Drawer Variances Report will be generated with the selected records only.
Figure 3.2
Selected List: You will have one flag to decide whether you want to "Include" or "Exclude" the selected records.
- Include: If the flag is selected as "Include," it means the Location Drawer Variances Report will be generated by applying the selected records. See Figure 3.2 above.
- Exclude: If the flag is selected to "Exclude," it means the Location Drawer Variances Report will be generated without including the selected records. See Figure 3.2 above.
- Once done, click on "Apply," and generate the report. See Figure 3.3 below.
- "Clear Selection" and the Remove icon are there for clearing the whole selection or only one selection, respectively.
Figure 3.3
4. Date Range & Presets
You can filter your sales data in the report by selecting the date range as well as specific times.
By clicking the edit box, you will get the tiny calendar to select the specific date range. You can also enter the date manually in mm/dd/yyyy format.
- Start Date: This field displays the associated calendar to pick the start date of the date range.
Figure 4.0
- End Date: This field displays the associated calendar to pick the end date of the date range.
Figure 4.1
- Presets: A Presets label is provided to select the specific duration/interval to generate the report.
5. Variance Filter
This filter allows you to display the "Location Drawer Variances Report" in filter-specific form. There are three options highlighted in Figure 5.0 in which reports can be displayed.
Figure 5.0
5.1. Variance Greater Than: If this option is selected, it will take a numerical value as input to display the filter-specific report, i.e., the resultant report will display the result with a variance value greater than the entered value. See Figure 5.1 for reference. Here, the entered value for variance is $10; thus the report will display the result for variance greater than $10. 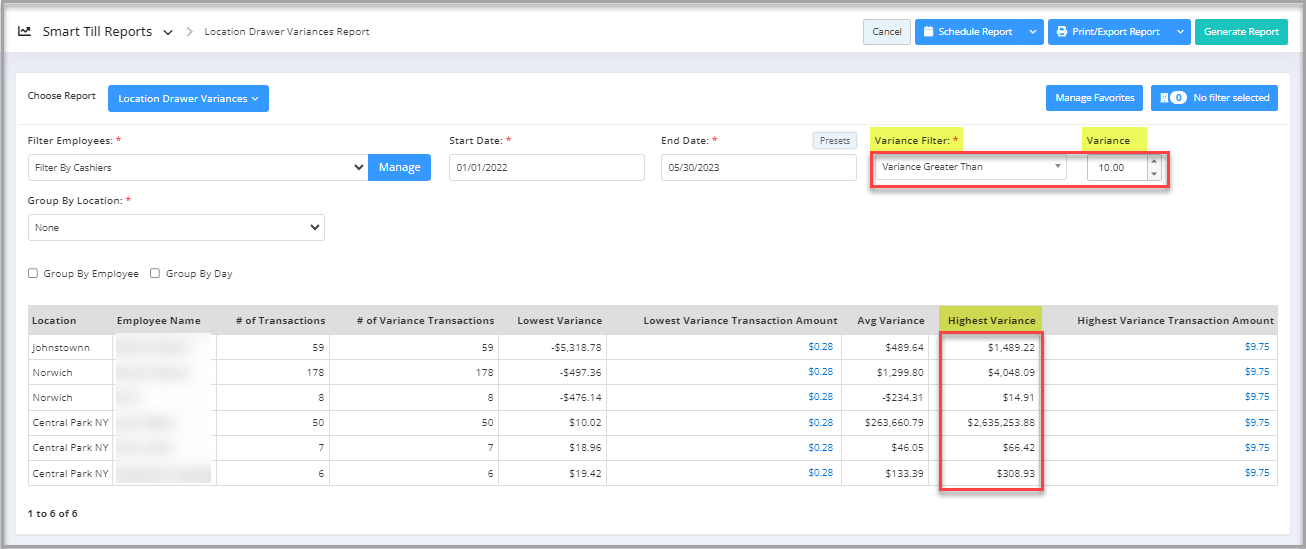 Figure 5.1
5.2. Variance Less Than: If this option is selected, it will take a numerical value as input to display the filter-specific report, i.e., the resultant report will display the result with a variance value lesser than the entered value. See Figure 5.2 for reference. Here, the entered value for variance is $5; thus the report will display the result for variance lesser than $5.
Figure 5.2
5.3. Variance Equal To: If this option is selected, it will take a numerical value as input to display the filter-specific report, i.e., the resultant report will display the result with a variance value equal to the entered value. See Figure 5.3 for reference. Here, the entered value for variance is $4; thus the report will display the result for variance equal to $4.
Figure 5.3
6. Group By:
This filter displays the report by grouping it by location or location groups.
6.1. None: This option is selected by default and doesn't affect the general details of the report.
6.2. Location: If this option is selected, the report will be displayed grouped by selected location.
Figure 6.1
6.3. Location Group: If this option is selected, the report will be displayed grouped by the selected location group.
Figure 6.2
7. Checkbox Filters
Figure 7.0
- Group By Employee: This filter will group the report by employee name.
Figure 7.1
- Group By Day: This filter will group the report by day.
Figure 7.2
Related Articles
Current Drawer Levels Report
Current Drawer Levels Report Overview The "Current Drawer Levels Report" data works in sync with the Smart Till feature, which helps in cash management by reducing cash losses and the cost of cash handling to improve in-store productivity. It tracks ...Employee Detailed Variances Report
Employee Detailed Variances Report Overview The "Employee Detailed Variances Report" lists variances determined by the Smart Till for the employee with the individual transactions that they stemmed from. Various types of filters can be applied to ...Cycle Count Variances
Cycle Count Variances Overview Reports -> Inventory Reports -> "Cycle Count Variances" This report type will display detailed information on cycle count variances for a specifically selected date range. Depending on your requirements, multiple ...In-Store Location Report
In-Store Location Report Overview In a retail environment, a single store may have multiple in-store locations — such as shelves, endcaps, promotional displays, or storage areas — where items are placed for sale. Properly tracking these locations ...Location Sales Report
Location Sales Report Overview The Location Sales Report shows location-wise sales data for the selected date range. The report provides fields with detailed and auto-calculated information for each store location. You can use various filters to ...