Transfers Report
Overview
The "Transfers Report" provides detailed product transfer data, showing the originating store and the destination store for each transfer. Users can configure various sorting options and filters to customize the report based on their specific requirements.
FTx Cloud POS displays product transfer records, including the names of the TO and FROM store locations, based on the selected filters. The report presents multiple fields with detailed information, including automatically calculated values, organized separately for each transfer type.
This article provides detailed information on the report, including transfers, key fields, and how to review product transfers between store locations.
Reaching the "Transfers Report"
To reach the "Transfers Report," follow the steps below:
- Step 1: Log into Control Center
- Step 2: Choose Point of Sale
- Step 3: Choose Reports
- Step 4: Choose Inventory Reports
- Step 5: Choose Transfers
See Figure 1.1. You will see many types of inventory reports that will be useful to your retail business. By clicking the "Choose Report" drop-down selection, you will see the different types of inventory reports.
Figure 1.1
2. Understanding the "Transfers Report" Layout
By clicking "Transfers Report," you will be redirected to "Transfers Report," where you can see relevant filtering and sorting options.
Figure 2.1
3. Generating the "Transfers Report"
To generate the "Transfers Report," follow the steps below. (See Figure 2.1 above).
- From the Inventory Reports page, you will see the "Choose Report" drop-down selection.
- By clicking the drop-down selection, you will see different types of inventory reports in alphabetical order.
- Search for "Transfers Report" from the list and click on it.
The following data gets fetched in tabular format when you click on the "Generate Report" button in the top right corner; the "Transfers Report" report will be displayed as highlighted in Figure 3.1.
Figure 3.1
The following data is displayed in a tabular format, providing a clear overview of items transferred to and from specific stores within the selected time period:
- Type: Indicates whether the transfer was initiated To or From the store, represented numerically.
- UPC: The Universal Product Code (UPC) is used for tracking items.
- Item Name: Displays the names of items transferred to or from the selected store.
- Quantity: Shows the number of units transferred From or To the store.
- Cost Each: Displays the cost per unit of each transferred item.
- Total Cost: Automatically calculated as (Cost per unit × Number of units transferred).
- Created By: Displays the name of the employee who initiated the transfer.
- Applied From: Shows the name of the employee who sent the transfer request.
- Applied To: Shows the name of the employee who received and accepted the transfer request.
- Applied By: Displays the name of the employee who processed the transfer.
- Time Stamp: Records the date and time when the transfer process was initiated.
- Vendor Parts: Displays the vendor part associated with the item.
4. Filter Options
Now, let's understand the custom filter options to generate the "Transfers Report" by setting up specific criteria. You can generate the "Transfers Report" for all store locations with the "Show All" option or a customized report with "Custom Filter."
Figure 4.0
You will see the different tabs to filter the items for the Transfers Report. You can choose the required filter category.
- You can select the saved custom filter from the drop-down selection.
- The "Manage Filters" button will open the list of saved custom filters. See Figure 4.1.
Figure 4.1
- Select Filter: You can select any filter from the list to generate the desired Transfers Report. Select the filter from the list, and then click on the "Select Filter" button. See Figure 4.1.
Figure 4.2
Manage Filters Screen Information:
1: Saved Filters: Select the saved custom filters from the Manage Filters drop-down (if any) and click "Apply" to apply the saved custom filter. The system will redirect you to the Transfers Report home screen. Click "Generate Report" to generate the report for the selected filter.2: Manage Filters: Clicking this button will also open the Manage Saved Filters screen.3: Parameters Tabs: You will see 6 tabs: Vendors, Department, Manufacturer, Tag, Vendor, and Department Tag. Select the required tab, i.e., Vendors, to create or apply a custom filter specific to the selected Vendors.4: Search: Use this Search box for a specific result.5: Match All Filters: The Match All Filters filter has two options: Match All Filters and Match Any Filters. Use this filter to decide whether or not the Manage Filter screen data matches all applied filters.6: Results: Here, you see the relevant list of data on the Manage Filter screen for the selected tab. For example, if you have chosen the Vendors tab, it will show the list of all vendors. You can use the "Search" bar for a specific UPC. You will see the data accordingly if you have applied the 4, 5, 6, or 7 filters.7: Selection Checkboxes: Select the required Vendors by checking the appropriate checkboxes.8: Arrow: Click the green Arrow button to move the selected records to the Selected Area.
The Manage Filters screen will look like the one in Figure 4.3:
Figure 4.3
1. Include or Exclude Toggle Button: When generating the report, you can decide whether to include or exclude the selected parameters in generating the report.
- Include: If you select "Include," the system will include all the specified parameters to generate the report.
- Exclude: If you select "Exclude," the system will exclude all the specified parameters to generate the report.
2. Click the "Clear Selection" button to remove the whole selection. To remove any record from the list, click the Remove (x) icon.
3. Apply or save the custom filter.
4. Click the "Apply" button. The system will redirect you to the Price Change Report home screen. Click "Generate Report" to generate the report.
- You can click the "Save Filters" button to save the custom filter for future use. Point 4.1.1, Save and Manage Custom Filter, explains the details.
4.1. Save Custom Filter
Please follow the steps below to save the configured custom filters for future use and manage the existing custom filters.
- Click the "Save Filters" button shown in Figure 4.1.
- The "Name" pop-up will appear, as shown in Figure 4.1.1.
Figure 4.1.1
- Click on "OK" to save the filter; once saved, click on "Apply" to apply the filters to the report.
1: Saved Filters Drop-Down: The saved custom filters will appear in the drop-down selection. You can select the required custom filter from the list for the report.2: Manage Filters: You can check and manage the filters by clicking the "Manage Filters" button. A list of the saved custom filters will appear in the Manage Saved Filters pop-up screen when you click on it.3: Filter Names: The filter name list shows all saved custom filters. Click on a filter name to select it.4: Select Filter: Use the "Select Filter" button to select any filter from the list.Click on the filter's name, and then click on the "Select Filter" button. The system will close the "Manage Saved Filters" pop-up screen. Click the "Apply" button on the Manage Filters screen. The system will navigate you to the Transfers Report home screen. Click "Generate Report" to generate the report for the selected filter.5: Delete: Use the "Delete" button to remove the filter no longer required from the list.Similarly, you can filter and set up the records for other tabs (parameters).
To generate the report with the specific data you've selected, apply a selection or choose a saved filter, then click the "Generate Report" button. The selected filter details are available under the Selected Filters label, as shown in Figure 4.1.1.
5. Transfer Location Filter
This filter allows you to filter the transfer records from All Stores or from Filtered Stores. By default, the Transfers from All Stores option is selected.
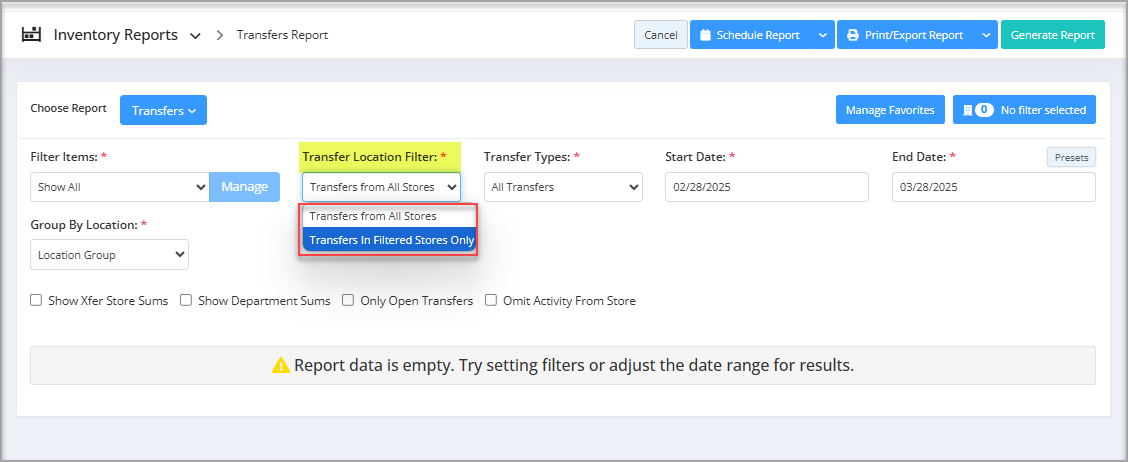
Figure 5.1
Figure 5.1
- Transfers from All Stores: Selecting this option will include transfer records from all store locations, regardless of any additional filters applied. This is useful for generating a complete overview of product transfers across the entire business. This option is selected by default. To see the report results, see Figure 3.1.
- Transfers from Filtered Stores: When this option is selected, the report will display transfer records only for stores that match the filters applied in the report. This helps narrow down results to specific store locations based on the user's selection criteria.
Figure 5.2
6. Transfer Types
The Transfer Types field offers three options to filter and display the Transfer Report based on the selected transfer type.
Figure 6.1
Transfer Types option explanation:
Transfer Types option explanation:
- All Transfers: This is the default selection, displaying all transfers, including both TO and FROM store transactions. See Figure 6.1.
- Show Transfer To: This option displays transfers where items are received at the selected store from any other store. In this case, item quantities are added to the store, and the Quantity column reflects positive values.
Figure 6.2 - Transfer From: This option displays transfers where items are sent from the selected store to another store. In this case, item quantities are deducted, and the Quantity column reflects a negative value.
Figure 6.3
7. Date Range
- You can filter your sales data in the report between 2 dates and select a specific time from the Start Date and End Date drop-down calendars.
- By clicking the Edit box, you will get the drop-down calendar to select the specific date range. You can also enter the date manually in mm/dd/yyyy format.
- You can also generate a report with a specific time duration (until morning/evening), and you can select the particular time (hours and minutes) from the date selection. See Figure 7.1.
- Start Date: This option lets you choose the starting date of the date range.
Figure 7.1
- End Date: This option lets you choose the ending date of the date range.
Figure 7.2
- Presets: It is provided to select the specific duration/interval to generate the Transfers Report according to the selected time period.
Figure 7.3
8. Group by Location
The Group By Location filter lets you view the report records segregated by Locations or Location Groups.
When you click the Group By Location drop-down, three options appear: None, By Location, and By Location Group, as Figure 8.1 shows. By default, the system selects "None." You can change it based on your requirements.
Figure 8.1
By Location: If this filter option is selected, the report results will be grouped by location name.
By Location Group: If this filter option is selected, the report results will be grouped by location group.
By Location: If this filter option is selected, the report results will be grouped by location name.
By Location Group: If this filter option is selected, the report results will be grouped by location group.
9. Checkbox Filters
The checkbox filters highlighted in Figure 9.1 below will impact the Transfers Report as described below:
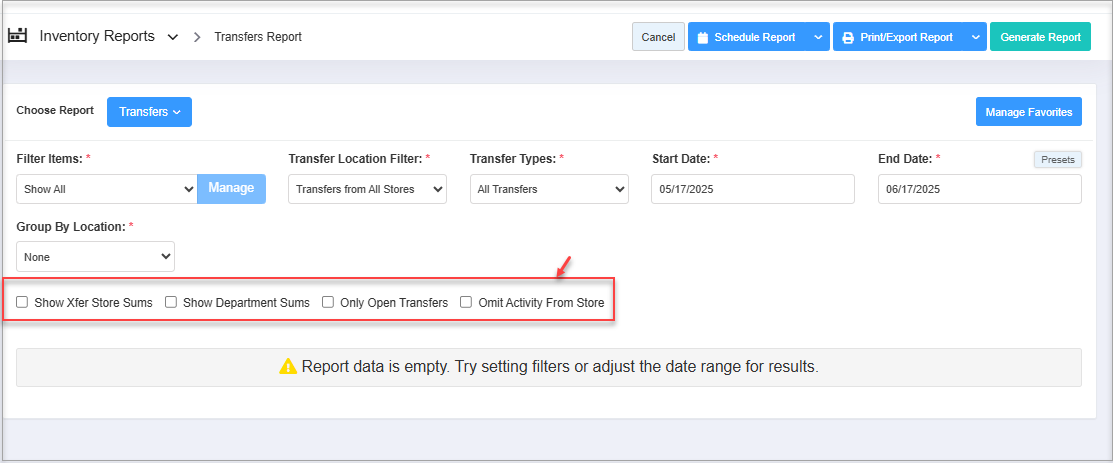
Figure 9.1
- Show Xfer Store Sums: This filter groups and totals individual store totals together. It makes it easier to see the summed totals for each location.
Figure 9.2
- Show Department Sums: This filter will display the Transfers Report department-wise.
Figure 9.3
- Only Open Transfers: This filter will organize the report with transfer records that have been created from one store and are in the queue to be accepted by another store. It implies that it will only show the records of the transfers that have just been initiated.
Figure 9.4
- Omit Activity From Store: This filter option will omit the transfer from the selected store. From the Omit from Store drop-down list, select the name of the city that you wish to omit.
Figure 9.5When this filter is applied, as depicted in Figure 9.5, store no. 2 Middletown is omitted, and in the report, no record for store 2 is shown.

You can select multiple checkbox filters, and the results will reflect their combined criteria.
Related Articles
Transfers
Transfers Overview A stock transfer is the warehouse logistics process of transferring products from one store to another. The goals of the stock transfer include: Optimizing the purchase process by leveraging extra stocks at some stores. Optimizing ...Suggested Transfers
Suggested Transfers Overview Stock transfers are essential to the retail business because they efficiently optimize perpetual inventory. FTx Cloud POS offers you an intelligent feature, "Suggested Transfers." This feature allows retailers to analyze ...Transfers - Store Employee
Transfers Overview In a retail business, a stock transfer refers to the internal movement of inventory from one location to another, such as between stores or from a warehouse to a store. It helps maintain balanced stock levels by shifting excess ...Transfer Cost Comparison Report
Transfer Cost Comparison Overview The "Transfer Cost Comparison Report" provides detailed insights into product transfers across all store locations within your company. It is designed to help you compare the cost and quantity of products moved ...Inventory Movement Report
Inventory Movement Report Overview Inventory Movement refers to tracking the physical transfer of products — whether it's receiving stock from a vendor or transferring items between store locations. For example, when your company receives products ...