Cost Changes Between Dates Report - Store Employee
Cost Changes Between Dates Report Overview
The "Cost Changes Between Dates Report" will list cost changes for pricebook zones between specific dates and the details of what and where they changed.
The system will display records of the cost changes for products only for the specifically selected date range. The system will also display the UPC, product name, old cost value, new cost value, date and time stamp when the old cost was changed to the new, and the change notes for each cost change record.
This article details the functionality and key features of the "Cost Changes Between Dates Report," which tracks and displays product cost changes within selected date ranges, including relevant product and change information.
1. Reaching the "Cost Changes Between Dates Report"
To reach the "Cost Changes Between Dates Report," follow the steps below:
- Step 1: Log into Control Center
- Step 2: Choose Location
- Step 3: Choose Reports
- Step 4: Choose Inventory Reports
- Step 5: Choose Cost Changes Between Dates
You’ll find a variety of inventory reports designed to support different aspects of your retail operations. To view them, click on the "Choose Report" drop-down menu. This will display a list of available inventory report types, each offering insights for effective inventory management. See Figure 1.1.
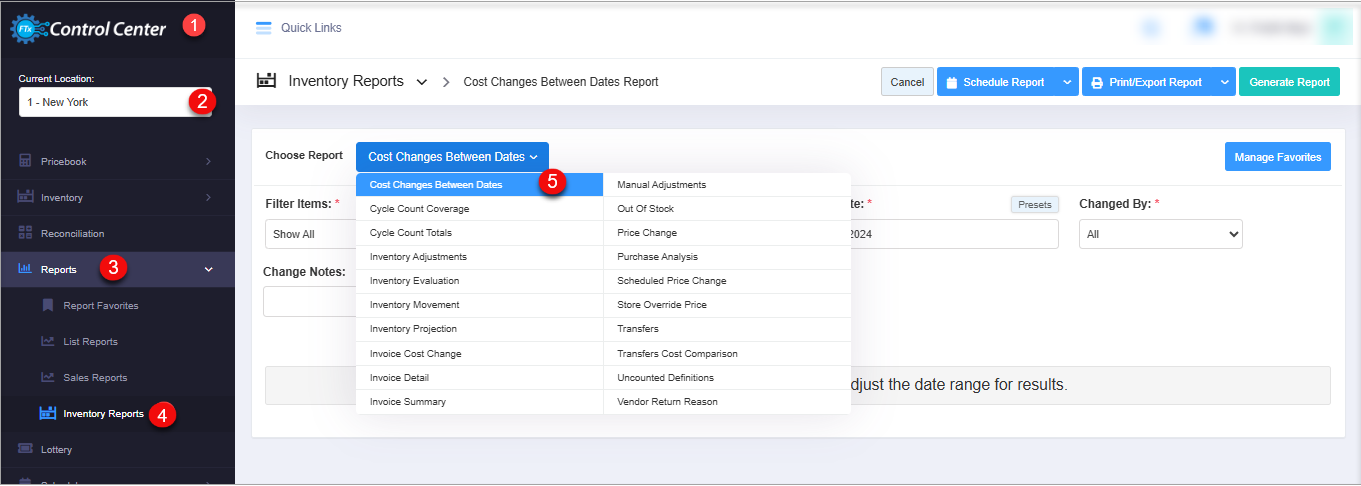
Figure 1.1
Figure 1.1
2. Understanding the "Cost Changes Between Dates Report" Layout
By clicking on "Cost Changes Between Dates," you will be redirected to the "Cost Changes Between Dates Report" page, where you can see relevant filtering and sorting options.
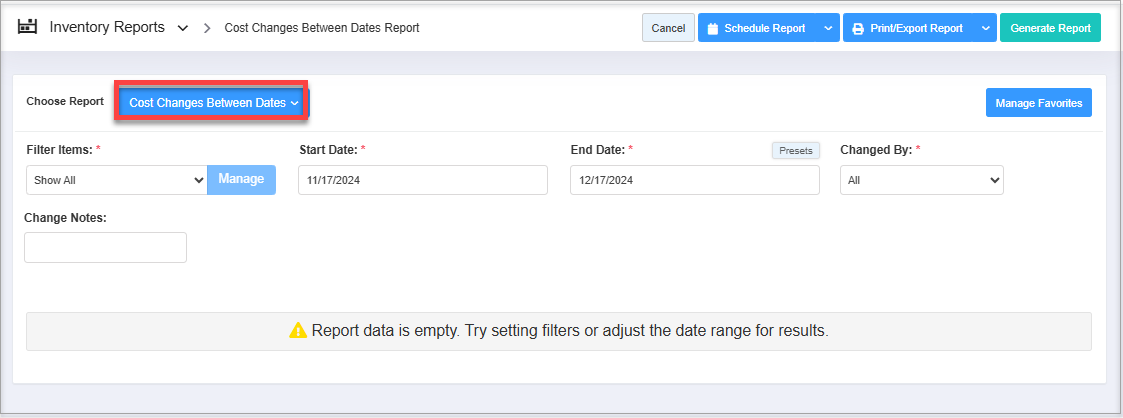
Figure 2.1
You will see the "Report data is empty" message initially. You need to select at least one date range to get the cost changes between dates by entering the days that have been counted since.
3. Generating the "Cost Changes Between Dates Report"
To generate the "Cost Changes Between Dates Report," follow the steps below.
- On the Inventory Report page, you will see the "Choose Report" drop-down selection.
- By clicking the drop-down selection, you will see different types of inventory reports in alphabetical order.
- Search for "Cost Changes Between Dates" from the list and click on it.
The following data gets fetched in tabular format when you click on the "Generate Report" button in the top right corner. The "Cost Changes Between Dates Report" will be displayed as highlighted in Figure 3.1.
Figure 3.1
Report Result Table Information:
- UPC: Standing for Universal Product Code, it is used to track items in the store. This column displays the UPCs of the products listed in the Cost Changes Between Dates Report.
- Item Name: Displays the actual name of each product.
- Pricebook Zone: A set of costs and prices assigned to items in your inventory. Select the applicable zone to generate the report.
- Old Cost: Shows the previous cost (buying price) of the item.
- New Cost: Displays the updated cost of the item.
- Change Date: Indicates the date when the cost was modified in the system.
- Change By: Identifies the user who made the cost change.
- Change Notes: Provides the reason or context for the cost update.
4. Filter Options
Using various filter options, FTx Cloud POS lets you view the report according to your preferences. You can configure the report with any single filter or a combination of multiple filters, as highlighted in Figure 4.1.
Figure 4.1
1: Report Filters:
- Filter Items: Filter Items lets you select the report data based on six parameters: UPC, Department, Category, Manufacturer, Vendor, and Tag. This means you can access the Cost Changes Between Dates Report for the selected parameter, i.e., items (UPCs), departments, or any other parameter. 4.1 Filter Items (Custom Filters) explains the further details.
- Date Range & Presets: This filter lets you select the report's time interval. 4.3 Date Range & Presets explains further details.
- Change by: Filter the report by the name of the person who made the cost changes.
4.1 Filter Items (Custom Filters)
The Filter Items feature allows you to view the report filtered by a specific parameter from the following options: UPC, Department, Category, Manufacturer, Tag, Brand, Vendor, and Department Tag. This lets you access reports focused on particular items (UPCs), departments, or other criteria.
In the Filter Items drop-down menu, you’ll find two choices: Show All and Custom Filters. By default, "Show All" is selected, meaning the report includes all parameters. Selecting "Custom Filters" enables you to filter the report based on a specific parameter from the same set of options.
To apply a custom filter, follow these steps:
- Choose "Custom Filter" from the Filter Items drop-down menu.
- Click the "Manage" button to configure your filter.
Figure 4.1.1
- The Manage Filters screen will appear, as Figure 4.1.2 shows.
Figure 4.1.2
1. Saved Filters Drop-Down: Select the saved custom filters from the Manage Filters drop-down (if any) and click "Apply" to apply the saved custom filter. The system will redirect you to the Cost Change Between Dates Report home screen. Click "Generate Report" to generate the report for the selected filter.2. Manage Filters: Clicking on this button will also open the Manage Saved Filters screen. 4.1.1 Save and Manage Custom Filters explains the details.3. Parameters Tabs: You will see eight tabs: UPC, Department, Category, Manufacturer, Tag, Brand, Vendor, and Department Tag. Select the required tab, i.e., "UPC," to create or apply a custom filter specific to the selected UPCs.4. Search: Use this Search box for a specific result.5: All Items: Use the All Items drop-down to filter the Manage Filters screen data based on four product parameters: All Items, Child Only, Parent Only, and Standalone Only. Choose the required parameter. This filter is available only for the "UPC" tab.6: Active Only: Use this filter to filter the Manage Filters screen data based on three product parameters: Active Only, Inactive Only, and All Records. This filter is available only for the UPC tab.7: Match All Filters Drop-Down: The Match All Filters filter has two options: Match All Filters and Match Any Filters. Use this filter to decide whether or not the Manage Filter screen data matches all applied filters.8: Results: Here, you see the relevant list of data on the Manage Filters screen for the selected tab. For example, if you have chosen the "UPC" tab, it will show the list of all UPCs. You can use the Search bar for a specific UPC. You will see the data accordingly if you have applied the 4, 5, 6, or 7 filters.9: Selection Checkboxes: Select the required UPCs by checking the appropriate checkboxes.10: Arrow: Click the green Arrow button to move the selected records to the Selected List Area.
The Manage Filters screen will look like the one in Figure 4.1.3.
Figure 4.1.3
1. Include or Exclude Toggle Button: When generating the report, you can decide whether to include or exclude the selected parameters.
- Include: If you select "Include," the system will include all the specified parameters to generate the report.
- Exclude: If you select "Exclude," the system will exclude all the specified parameters to generate the report.
2. Click the "Clear Selection" button to remove the whole selection. To remove any record from the list, click the Remove (x) icon.3. Apply: Click the "Apply" button for the selected parameters. The system will navigate you to the Cost Changes Between Dates Report home screen. Click "Generate Report." The system will generate reports based on your selection.4. Save Filters: Click the "Save Filters" button to save the custom filter for future use. 4.1.1 Save and Manage Custom Filters explains the details.
4.1.1 Save & Manage Custom Filters
Please follow the steps below to save the configured custom filters for future use and manage the existing custom filters.
- Click the "Save Filters" button shown in Figure 4.1.3.
- The Name pop-up will appear, as shown in Figure 4.1.1.1.
- Enter the name of the custom filter and click "OK." The system will save the filter.
Figure 4.1.1.1
- You can use the saved custom filter whenever you need it and delete it when you don't need it anymore. Open the Manage Filters screen again and use the steps shown in Figure 4.1.1.2 according to your requirements.
Figure 4.1.1.2
1. Saved Filters Drop-Down: The saved custom filters will appear in the drop-down selection. You can select the required custom filter from the list for the report.2. Manage Filters: You can check and manage the filters by clicking the "Manage Filters" button. When you click on it, a list of the saved custom filters will appear in the Manage Saved Filters pop-up screen.3. Filter Names: The Filter Name list shows all saved custom filters. Click on a filter name to select it.4. Select Filter: Use the "Select Filter" button to select any filter from the list.Click on the filter's name, and then click on the "Select Filter" button. The system will close the "Manage Saved Filters" pop-up screen. Click the "Apply" button on the Manage Filters screen. The system will navigate you to the Cost Changes Between Dates Report home screen. Click "Generate Report" to generate the report for the selected filter.5: Delete: Use the "Delete" button to remove the filter no longer required from the list.Similarly, you can filter and set up the records for other tabs (parameters).
To generate the report with the specific data you've selected, apply a selection or choose a saved filter, then click the "Generate Report" button. The system will generate the report based on your specific choice, and the selected filter details will be available under the Selected Filters label, as Figure 4.1.1.3 shows.
Figure 4.1.1.3
4.2 Date Range
You can filter your data in the report between the dates and select a specific time from the Start Date and End Date drop-down calendars.
- By clicking the Edit box, you will get a tiny calendar to select the specific date range. You can also enter the date manually in mm/dd/yyyy format.
- You can also generate a report with a specific time duration (until morning/evening), and you can select the particular time (hour and minutes) from the date selection. See Figure 4.2.1, Figure 4.2.2, and Figure 4.2.3.
- Start Date:Specify the beginning of the date range.Figure 4.2.1
- End Date: Specify the end of the date range.Figure 4.2.2
- Presets: The presets label is provided to select the specific duration/interval to generate the report for Cost Changes Between Dates Report according to the selected time period. See Figure 4.2.3.
Figure 4.2.3
5. Scheduling a Report
FTx Cloud POS supports report automation. You can configure a report and schedule it. The system will send the scheduled report to the indicated email addresses at the defined frequencies (daily, weekly, bi-weekly, monthly, quarterly, etc.).
Please refer to Scheduling a Report to learn how to schedule a report.
6. Printing/Exporting a Report
You can print or export any report according to your requirements. When you use the Print function, the system creates and opens the report's PDF file in a new tab. You can download the soft copy or print the paper copy according to your requirements.
Please refer to Printing a Report to learn how to print or export a report.
7. Manage Favorites
FTx Cloud POS allows quick access to the reports you need to view frequently through "Favorite Reports." You can save a report as a favorite and manage all your favorite reports from any of the report screens using the "Manage Favorites" button.
Related Articles
Employee Sales Report - Store Employee
Employee Sales Report Overview The "Employee Sales Report" in the FTx Cloud POS system is a detailed summary that tracks and displays individual employees' sales performance over a selected period. This article includes information about: How to ...Item Sales Report - Store Employee
Item Sales Report Overview The "Item Sales Report" in the POS system is a detailed report that shows sales performance at the individual item or product level. It's a crucial tool for inventory management, sales analysis, and business ...Transfers - Store Employee
Transfers Overview In a retail business, a stock transfer refers to the internal movement of inventory from one location to another, such as between stores or from a warehouse to a store. It helps maintain balanced stock levels by shifting excess ...Cycle Counts - Store Employee
Cycle Counts - Store Employee Overview In a POS retail business, cycle counts are routine inventory checks where small portions of stock are counted regularly to maintain accuracy without disrupting operations. Instead of conducting a complete ...Purchase Orders - Store Employee
Purchase Orders Overview A Purchase Order (PO) is a process used to procure products for a store from a vendor. You can create a purchase order, specifying the vendor, quantities, and agreed prices for products. POs can only include parent items and ...