Hourly Sales Report
Hourly Sales Report Overview
This report type provides the total sales data for each working hour within a specified date range.
The system aggregates sales data for each hour across all days in the selected date range. This helps identify the specific hours when a store experiences the highest or lowest sales activity.
For example, if you select a 10-day date range and the store operates from 8 AM to 7 PM, the system will calculate total sales for each hour — such as total sales recorded at 8 AM across all 10 days, then at 9 AM, 10 AM, and so on through 7 PM.
In this article, you will learn how to configure different filters to fetch custom report results.
1. Reaching the "Hourly Sales Report"
To reach the "Hourly Sales Report":
- Log into Control Center
- Choose Point of Sale
- Choose Reports
- Choose Sales Reports
- Choose Hourly Sales
See Figure 1.1. You will see many types of inventory reports that will be useful to your retail business. By clicking the "Choose Report" drop-down selection, you will see the different types of inventory reports.
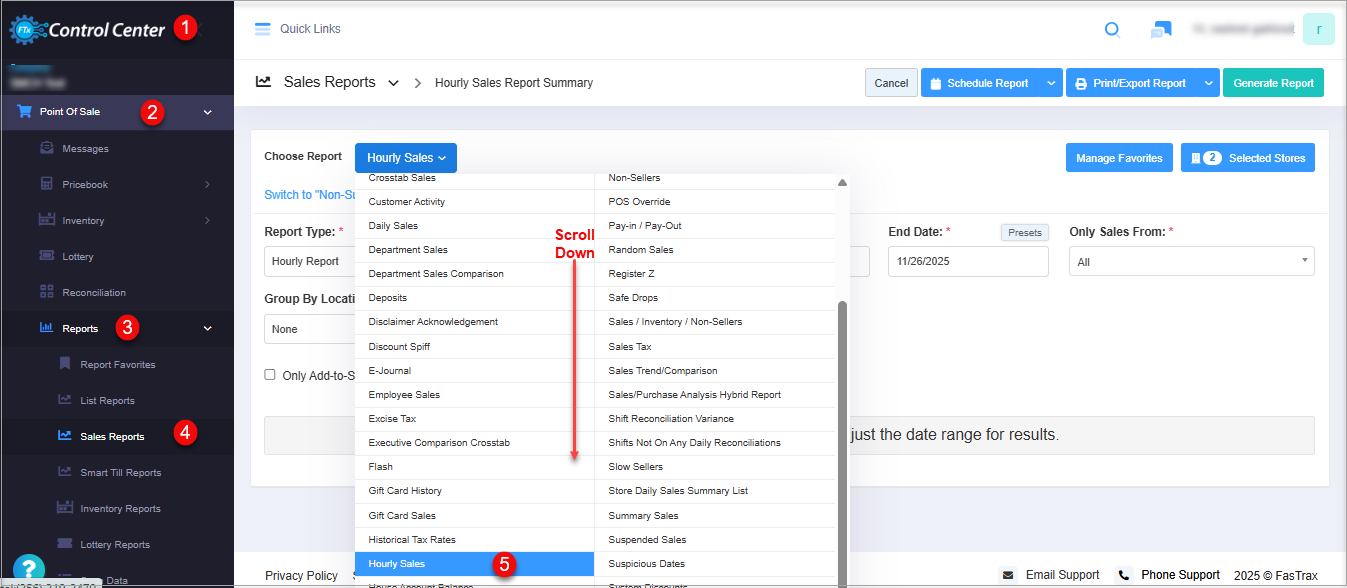
Figure 1.1
Figure 1.1
2. Understanding the "Hourly Sales Report" Layout
By clicking "Hourly Sales Report," you will be redirected to the "Hourly Sales Report," where you can see relevant filtering and sorting options. Initially, you will see an alert message: "Report data is empty." Try setting filters or adjusting the date range for results."
Figure 2.1
3. Generating the "Hourly Sales Report"
- Navigate to the Hourly Sales Report screen.
- Select the date range and click "Generate Report" to view the "Hourly Sales Report" for the selected date range.
- You can use the Report Type, Filter Items (Custom Filters), Date Range & Presets filters, Only Add-to-Sales Departments, Group by Register, and Group by Day checkbox filters to create the report that meets your requirements. You can use multiple filters to make the report more specific. Please refer to point 3. Report Filter Options, to learn more about these filters.
- Click "Generate Report" whenever you change your selection in any field to view the updated report.
- When you click the "Generate Report" button after selecting the date range, the system will show the store-wise report records, as Figure 3.1 shows.
Figure 3.1
Report Information:

Bar Graph: It visually represents the report.
- X-Axis: The x-axis represents the hours.
- Y-Axis: The y-axis represents the sales amount in dollars.
Report Description (Figure 3.1):
- Hour of Day: This shows the time stamp of the day when the item/product was sold.
- Net Sales: This gives the details of the net sales that were procured up until that time stamp.
- Sales: This provides details about the number of sales transactions until that time of day.
- Total Qty: This shows the number of items that are sold until that time of the day.
- Discounts: This displays the details of the discount, if any are applied.
- Total Cost: It displays the total cost of the items as they originally cost, without the discount deduction.
- Buydowns: This is the reduction of an item’s retail price derived from a reduction of the item’s cost from the supplier.
- Adj Cost: This represents the adjusted cost against the "Total Cost" of the sold item. i.e., Adj Cost = Total Cost - (deducted) Buydown (if any applied).
- $ Margin: This dollar margin is derived by Net Sales - Adj Cost - Discount.
- % Margin: Margin % is calculated as $ Margin x100/Net Sales - Discount.
- % of Total: This "% of Total" is calculated by - Net Sale/Total Net Sales x100.
When a report contains a single page, the total shown at the end of the page represents the Grand Total. When the report spans multiple pages, each page displays a Page Total for the records shown on that page.4. Report Fields
FTx Cloud POS lets you view the Hourly Sales Report records according to your preferences using various filter options. As highlighted in Figure 4.1, you can configure the report with any single filter or a combination of multiple filters.
Figure 4.1
Report Filters:
- Report Type: The Report Type filter lets you generate the report based on two parameters: Hourly Report and Summary Report. 4.1 Report Type explains further details.
- Filter Items: The Filter Items (Custom Filters) filter lets you view the report based on a selected parameter from five available options: Department, Category, Manufacturer, Tag, and Department Tag. This means you can access the Hourly Sales Report for the selected parameter, i.e., departments, tags, or any other parameter. For further details, refer to section 4.2 Filter Items (Custom Filters).
- Date Range & Presets: This filter lets you select the report's time interval. 3.3 Date Range & Presets explains further details.
- Checkbox Filters:
- Only Add-to-Sale Departments: If you tick this checkbox, the system will show only records for which the "Include in Sales Reporting" feature is enabled at the "Department" level. The report will show the records based on your selection. However, the report format will be the same as shown in Figure 4.1.
When creating or editing a "Department," the corporate employee can use the Include in Sales Reporting feature to determine whether to include the department's sales data in the overall sales report. This feature is typically used to distinguish between items that contribute to the business's income and those that don't.
- Group By Register: If you tick this checkbox when generating the report, the system will organize the report records based on the Register number on which the sales were performed. 4.5 Checkbox Filters explains further details.
- Group by Day: If you tick this checkbox when generating the report, the system will organize the report records based on sales days. 4.5 Checkbox Filters explains further details.
4.1. Report Type
The Report Type filter lets you view the Hourly Sales Report based on two parameters: Hourly Report and Summary Report.
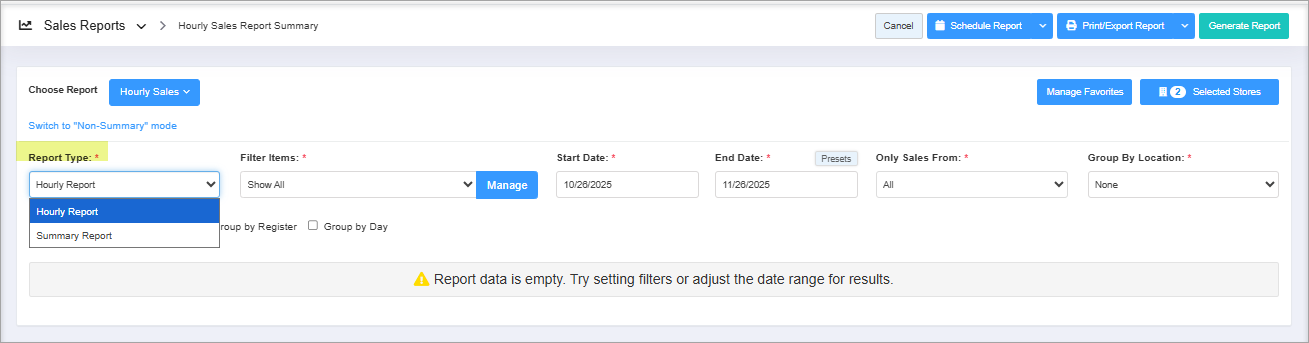
Figure 4.1.1
Figure 4.1.1
- Hourly Report: The system selects this option by default and generates the report based on hours, as Figure 3.1 shows.
- Summary Report: When you choose this option, the report is generated in a summary format, as Figure 4.1.2 shows.
Figure 4.1.2
Report Fields:
- # of Transaction: This shows the number of transactions during the selected time frame.
- Net Sales: This details the net sales procured until that time stamp.
- Total Qty: This shows the number of items sold until that time of day.
- Discounts: This displays the discount details, if any are applied.
- Total Cost: It displays the total cost of the items as they originally cost, without the discount deduction.
- Buydowns: This is the reduction of an item’s retail price derived from a reduction of the item’s cost from the supplier.
- Adj Cost: This represents the adjusted cost against the "Total Cost" of the sold item. i.e., Adj Cost = Total Cost - (deducted) Buydown (if any applied).
- $ Margin: This dollar margin is derived by Net Sales - Adj Cost - Discount.
- % Margin: Margin % is calculated as - $ Margin x100/Net Sales - Discount.
- % of Total: This "% of Total" is calculated by - Net Sales/Total Net Sales x100.
When a report contains a single page, the total shown at the end of the page represents the Grand Total. When the report spans multiple pages, each page displays a Page Total for the records shown on that page.
4.2. Filter Items (Custom Filters)
The Filter Items (Custom Filter) filter lets you view the report based on a selected parameter from five options: Department, Category, Manufacturer, Tag, and Department Tag. This means you can access the report for the selected parameter, i.e., departments, categories, or any other parameter.
The Filter Items drop-down menu has two options: Show All and Custom Filters. By default, the system selects "Show All" and considers all parameters to generate the report. You can change it to "Custom Filter" to view the report based on a specified parameter from five available options: Department, Category, Manufacturer, Tag, and Department Tag.
Please follow the steps below to make the required selections:
- Select the "Custom Filter" option in the Filter Items drop-down and click the "Manage" button.
Figure 4.2.1
- The Manage Filters screen will appear, as shown in Figure 4.2.2.
Figure 4.2.2
- 1: Saved Filters Drop-Down: Select the saved custom filters from the Manage Filters drop-down (if any) and click "Apply" to apply them. The system will redirect you to the Home Screen for the Hourly Sales Report. Click "Generate Report" to generate the report for the selected filter.
- 2: Manage Filters: Clicking this button will also open the Manage Saved Filters screen. Section 3.2.1 Save and Manage Custom Filters explains the details.
- 3: Parameters Tabs: You will see five tabs: Department, Category, Manufacturer, Tag, and Department Tag. Select the required tab, i.e., "Department," to create or apply a custom filter specific to the selected departments.
- 4. Search: Use this Search box to find a specific result.
- 5: Match All Filters Drop-Down: This filter has two options, "Match All Filters" and "Match Any Filters." Select either option to determine whether the Manage Filters screen data matches all applied filters. This drop-down is useful when you use multiple parameter tabs. For example, you choose a few manufacturers from the "Manufacturer" tab and a few departments from the "Department" tab.
- 6: Results: This section shows the list of relevant items in the selected tab. For example, if you have chosen the "Department" tab, it will show the list of departments. You can use the Search bar for a specific department.
- 7: Selection Checkboxes: Select the required departments by checking the corresponding checkboxes.
- 8: Arrow: Click the green Arrow button to move the selected records to the Selected List.
- The Manage Filters screen will appear as shown in Figure 4.2.3.
Figure 4.2.3
- 1: Include or Exclude Toggle Button: When generating the report, you can decide whether to include or exclude the selected parameters.
- Include: Select "Include" to include all specified parameters in the report generation process.
- Exclude: Selecting "Exclude" will cause the system to exclude all specified parameters from generating the report.
- 2: Clear Selection: Click the "Clear Selection" button to remove the whole selection. To remove a single record from the list, click the Remove (x) icon next to the record.
- 3: Apply: Click the "Apply" button for the selected parameters. The system will navigate you to the home screen for the Hourly Sales Report. Click "Generate Report" to have the system generate reports based on your selection.
- 4: Save Filters: Click the "Save Filters" button to save the custom filter for future use. Section 4.2.1. Save and Manage Custom Filters explains the details.
4.2.1 Save & Manage Custom Filters
Please follow the steps below to save the configured custom filters for future use and manage the existing custom filters.
- Click the "Save Filters" button shown in Figure 4.2.3.
- The Name pop-up will appear, as shown in Figure 4.2.1.1.
Figure 4.2.1.1
- Enter the name of the custom filter and click "OK." The system will save the filter.
- The system will save the filter. You can use the saved custom filter whenever needed and delete it when no longer required. To do so, reopen the Manage Filters screen and follow the steps shown in Figure 4.2.1.2 according to your specific requirements.
Figure 4.2.1.2
- 1: Saved Filters Drop-Down: The saved custom filters will appear in the drop-down selection. You can select the required custom filter from the list and click "Apply."
- 2: Manage Filters: You can check and manage the filters by clicking the "Manage Filters" button. When you click it, a list of saved custom filters will appear in the Manage Saved Filters pop-up screen.
- 3. Filter Names: The Filter Names section lists all saved custom filters. Click on a filter name to select it.
- 4: Select Filter: Use the "Select Filter" button to select any filter from the list.
- Click on the filter's name, and then click on the "Select Filter" button. The system will close the Manage Saved Filters pop-up screen. Next, click the "Apply" button on the Manage Filters screen. The system will navigate you to the home screen for the Hourly Sales Report. Click "Generate Report" to generate the report for the selected filter.
- 5. Delete: Use the "Delete" button to remove the filter no longer required from the list.
- Similarly, you can filter and set up the records for other tabs (parameters).
- To generate the report with the specific data you've selected, apply a selection or choose a saved filter, then click the "Generate Report" button.
- The system will generate the report based on your specific choice, and the selected filter details will be displayed under the Selected Filters label, as shown in Figure 4.2.1.3.
Figure 4.2.1.3
5. Date Range
You can filter your data in the report between the dates and select a specific time from the Start Date and End Date drop-down calendars.
- By clicking the Edit box, you will get the drop-down calendar to select the specific date range. You can also enter the date manually in mm/dd/yyyy format.
- You can also generate a report with a specific time duration (until morning/evening), and you can select the particular time (hour & minutes) from the date selection.
- Start Date: This option lets you set the start date for the selected date range.
Figure 5.1
- End Date: This option lets you set the end date for the selected date range.Figure 5.2
- Presets: The Presets label is provided to select the specific duration/interval to generate the "Hourly Sales Report" according to the selected time period.
Figure 5.3
6. Only Sales From
This filter lets you restrict the report to sales made on specific days of the week. By selecting a particular day, such as Monday, Thursday, or Friday, the report will only display sales recorded on that chosen day.
Selecting All will include sales from every day within the selected date range.
Figure 6.1
7. Group By Location
The Group By Location filter lets you view the records segregated by Locations or Location Groups. You can select a specific location to generate the location-specific report by clicking on the No Filter Selected button to select a location.
Figure 7.1
- By Locations: If you select the By Location option, the system will display records grouped according to locations, as Figure 7.1 shows. The report will also show the total payment amount made using coupons at each location for the selected duration.
Figure 7.2
- By Location Group(s): This option will group the sales data in a report on an hourly basis according to the predefined location groups.
Figure 7.3
8. Checkbox Filters
A few filters are available that can be applied to fetch the custom results.
- Only Add-to-Sales Department: This option filters the report to include only those departments that are marked as "Add-to-Sale" in the "Departments" module. If a department has this setting enabled, its sales will appear in the report; if it is disabled, the department’s sales will be excluded from the results.
Figure 8.1 - Group by Register: This filter displays sales transactions processed through a specific register at a particular time.Figure 8.2
- Group by Day: The option filters all the hourly sales reports day-wise for the selected date range.
Figure 8.3
9. Filtering Stores and Locations
The Store and Location Group filter lets you view the report for selected stores (locations) and location groups. Please refer to Filtering Stores and Locations in a Report to learn how to filter a report and fetch custom results.
10. Scheduling a Report
FTx Cloud POS supports report automation. You can configure a report and schedule it. The system will send the scheduled report to the indicated email IDs at the defined frequencies (daily, weekly, bi-weekly, monthly, quarterly, etc.).
11. Printing/Exporting a Report
You can print or export any report according to your requirements. When you use the Print function, the system creates and opens the report's PDF file in a new tab. You can download the soft copy or print the paper copy according to your requirements.
12. Manage Favorites
FTx Cloud POS allows quick access to the reports you need to view frequently through "Favorite Reports." You can save a report as a favorite and manage all your favorite reports from any of the report screens using the "Manage Favorites" button.
Related Articles
Hourly Sales Report - Store Employee
Hourly Sales Report Overview The "Hourly Sales Report" summarizes all sales by the hour for a specific date range. The system compiles sales data for each hour across all days within the selected date range. This allows for the identification of ...Employee Sales Report
Employee Sales Report Overview The "Employee Sales Report" helps identify the employees who made maximum/minimum sales in the selected date range. These reports work with different types of filters that can be configured depending on the ...Item Sales Report
Item Sales Report Overview The sales reports must track the sales details, stocks on hand, profits, and other parameters to monitor your item sales. Several sales reports are available, providing valuable insights and detailed statistics on the ...Summary Sales Report
Summary Sales Report Overview As a sales manager or super-admin user, you need to keep an eye on the overall sales and earnings from different payment modes during the specific date range. This will help you create strategies and discounts to boost ...Brand Sales Report
Brand Sales Report Overview The "Brand Sales Report" displays all sales for the brand within a specified time frame. A Brand Sales Report is essential for analyzing a brand's performance within a company. It’s a strategic tool for understanding, ...