Inventory Evaluation Report
Inventory Evaluation Report
Reports -> Inventory Reports -> Inventory Evaluation Report
To effectively monitor product inventory, inventory reports must provide insights into available stock, total cost, and retail price. FTx Cloud POS offers a variety of inventory reports that present comprehensive details regarding stock levels, associated costs, and pricing information.
These reports can be generated using a range of custom filters and customization options, allowing users to efficiently track and manage inventory. Additionally, various tools are available to categorize and segment the records within the generated reports for easier analysis.
This technical document outlines the steps to generate the "Inventory Evaluation Report," utilizing filter options and margin-based price calculations.
1. Reaching the "Inventory Evaluation Report"
To reach the "Inventory Evaluation Report," follow the steps below:
- Step 1: Log into Control Center
- Step 2: Choose Point of Sale
- Step 3: Choose Reports
- Step 4: Choose Inventory Evaluation
Please see Figure 1.1 to understand the navigation better. 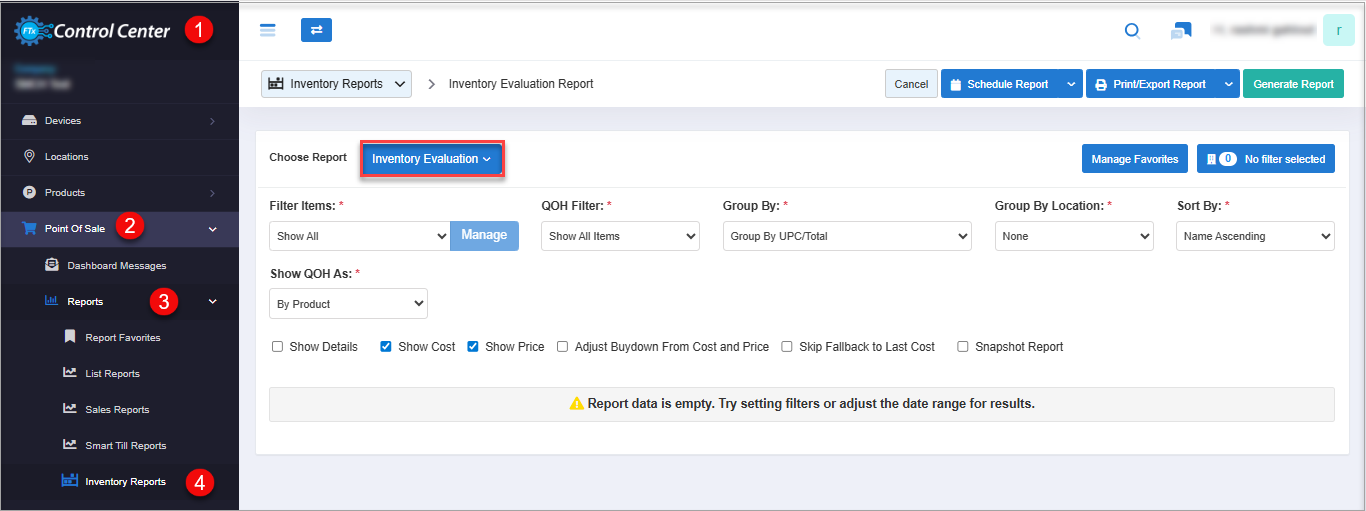 Figure 1.1
2. Understanding the "Inventory Evaluation Report" Layout
When you click on "Inventory Reports" from the left navigation panel, you will see the empty report data results. By default, another type will be selected in the Choose Report drop-down.
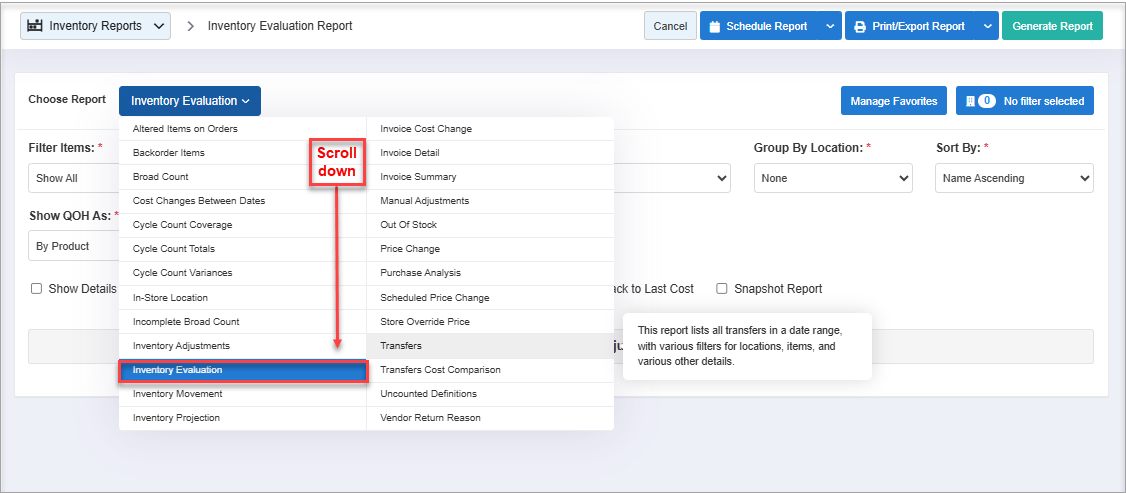
Figure 2.1
Choose "Inventory Evaluation" from the drop-down and select the appropriate filters to begin generating the desired report results. All the components of the report are explained below section-wise.
Refer to the TOC to understand the components separately.
3. Generating the "Inventory Evaluation Report"
Once you click the "Inventory Evaluation" report type, you will be presented with relevant filter options to customize the inventory report accordingly. You have many bifurcation options to generate the reports and check the different statistics of the inventory.
Figure 3.1
From Figure 3.1 above.
1. Customer filters, grouping, and other filter options.2. Bifurcate options for the Inventory Evaluation Report.
- Note: The custom filters and bifurcation options might vary as per the type of report selection.
3. By clicking "Generate Report" from the top-right corner, the Inventory Evaluation Report will be generated and appear on the screen. See Figure 3.2.
- After generating the report, check the Inventory Evaluation Report with the predefined selection of filter options (the system's default selection and without any custom filter option setup).
- You will see the overall total available stocks (QOH) with the Total Retail, Total Cost, and Margin ($).
Figure 3.2
Now, apply the desired filters (explained below in heading 6. Checkbox Filters) and click the "Generate Report" button to view the inventory report along with product details.
Refer to Figure 3.3.
Figure 3.3
You will see the following sales data in tabular format when you generate the Inventory Evaluation Report (above in Figure 3.3):
- UPC: This represents the item's UPC that was inserted during the product creation. The UPC is scanned and sold on the register. This is the actual product sold to customers. Use the hyperlinked UPC to navigate to the Product's page.
- Product Name: This represents the name of the product.
- Vendor Part: This represents the vendor part number of the product that is received on an invoice and adds products to the store's inventory to be sold to customers.
- QOH: This represents the current stock of each product.
- Retail Each: This represents the retail price per product. Although the retail price for each product will vary as per price book zones, the highest retail price will be displayed here.
- Total Retail: This represents the total retail price of available stocks (QOH).
- Total Retail = QOH x (multiply) Retail Each (retail price per product), i.e., Calculation for Black Big [CTN] product, 3020 (QOH) x 23.50 (Retail Each) = $ 70,970 (Total Retail).
- Cost Each: This represents the cost per product. Although the cost for each product will vary according to pricebook zones, the highest product's cost will be displayed here.
- Total Cost: This represents the total product's cost of available stocks (QOH).
- Total Cost = QOH x (multiply) Cost Each (retail price per product), i.e., Calculation for Black Big [CTN] product, 3020 (QOH) x 22.00 (Cost Each) = $ 66,440 (Total Cost)
- Profit ($): This represents the total profit in $ amount as per the calculation between [Total Retail - (minus) Total Cost] of a product.
- Margin (%): This represents the margin that gains or loses in percentage. % Margin will calculate the margin against the Total Retail in percentage.
- Margin in percentage = [Profit/(divided) Total Retail] * 100, i.e., Calculation for % Margin for Black Big [CTN], $ [4,530 (Profit) / 71,970 (Total Retail)] *100 = 6.38 % (Margin in %).
- Grand Totals: This calculates the totals of all the available stocks for each product, including the total retail, total cost, and profit that would be earned after selling the products.
 Note: The data in the Inventory Evaluation Report is generated based on the current stocks at different stores (locations).
4. Report Filter Options
Now, let's understand the custom filter options to generate the Inventory Evaluation Report by setting up specific criteria.
4.1 Custom Filters for Items
Now, let's see how to filter the items to generate the desired Inventory Evaluation Report. You will see the Filter Items drop-down option, from which you can customize the item selection.
Figure 4.1.1
You will find the two options from the Filter Items drop-down selection:
- Show All: It considers all the data (criteria) to generate the report. The "Manage" button will be disabled for this option. By default, this option will be preselected.
- Custom Filter: To customize the items for the report, you need to select the "Custom Filter" option. Once you select it, the "Manage" button will be enabled to set up the filters.
Figure 4.1.2
By clicking the "Manage" button, a Manage Filters window will pop up. You will see the following details: (See Figure 4.1.3 below.)
- You will see the different tabs to filter the items for the Item Inventory Evaluation Report. You can choose the required records by navigating the tabs individually to generate your desired Inventory Evaluation Report.
- You can select the saved custom filter from the drop-down selection. The "Manage Filters" button will open the list of saved custom filters.
- You will find the checkbox along with all the records. You need to select the items from the list and move them to the Selected List on the right side.
- Once you select the records from the list, click on the green right-sided arrow (Move button) to move the records to the Selected List.
- By clicking the Move button, the selected records will be moved to Selected List. So, the Inventory Evaluation Report will be generated with the selected records only.
Figure 4.1.3
- You can remove any record from the list by clicking the Remove (x) icon. If you want to remove the whole selection, click the "Clear Selection" button.
Figure 4.1.4
Selected List: You will have one flag to decide whether you want to include or exclude the selected records when the Inventory Evaluation Report is generated.
- Include: If the flag is selected to "Include," it means the Inventory Evaluation Report will be generated by applying the selected records. See Figure 4.1.4 above.
- Exclude: If the flag is selected to "Exclude," it means the Inventory Evaluation Report will be generated but will ignore the selected records. It will consider the selected records that need to be excluded to generate the sales report and the left-side records for reports. See Figure 4.1.5 below.
Figure 4.1.5
- When you need to avoid some of the records in the Inventory Evaluation Report that are not required, you can select those few records from the list (from the left side to the right side) and select "Exclude." So when the report is generated, you will not see inventory details for the records in the Inventory Evaluation Report.
- Similarly, you can filter and set up the records for other tabs (parameters). Once the specific records are selected from the filter options (tabs), you can generate the Inventory Evaluation Report by clicking the "Apply" button and then the "Generate Report" button from the main page.
Figure 4.1.6
4.1.1 Save & Manage Custom Filter
You can also save the configured custom filters for future use. By clicking the "Save Filters" button, a pop-up will appear asking you to enter the name of the custom filter.
Figure 4.1.1.1
Enter the name of the custom filter and click the "OK" button to save it.
Saved Filter:
The saved custom filters will appear in the drop-down selection. You can select the required custom filter from the list for the inventory report.
The saved custom filters will appear in the drop-down selection. You can select the required custom filter from the list for the inventory report.
Figure 4.1.1.2
Manage Filters:
You can check and manage the filters by clicking the "Manage Filters" button. By clicking on it, you will see a listing of the saved custom filters in a pop-up.
Figure 4.1.1.3
- Select Filter: You can select any filter from the list to generate the desired Inventory Evaluation Report. Select the filter from the list and then click on the "Select Filter" button.
- Delete: You can delete any filter from the list that is no longer required. Select the filter and then click on the "Delete" button.
4.1.2 Search Records
- Search Edit Box: You can search for a specific record by entering text. You will see this search box in all the tabs (parameters).
- Select Parent-Child: You can filter the UPC list records by selecting All Items, Child Only, Parent Only, or Standalone Only. You will see this drop-down selection only for UPC (product selection).
- Select Active-Inactive: You can filter the list of records for many tabs (parameters) by selecting Active Only, Inactive Only, or All Records.
Figure 4.1.2.1
In this way, the Custom Filter options (tabs) help to customize the item records and set up the options to get only the required data for the Inventory Evaluation Report.
4.2 QOH Filter
"QOH Filter" lets you view the items in the report with predefined QOH values.
Please follow the steps below to view the report records with conditional QOH values.
- Click the QOH Filter drop-down filter.
- From the list of options, select the desired filter based on Quantity On Hand (QOH) as described below.Figure 4.2.1
- As Figure 4.2.1 shows, the seven options will appear: Show All Items | Only Items > X | Only Items < X | Only Items >= X | Only Items <= X | Only Items = X | Only Item <> X
- The system selects "Show All Items" by default. X is the required quantity you specify. When you select any of the other options, the X Value field will appear, as Figure 4.2.2 shows. Enter the desired X value in it.
- For example, you choose to enter 6.
Figure 4.2.2
- Only Items > X: Selecting this option will generate a report displaying items with Quantity on Hand (QOH) values greater than the amount you specified. In this example, it will show the items that have QOH > 6.
- Only Items < X: Selecting this option will generate a report displaying items with Quantity on Hand (QOH) values less than the amount you specified. In this example, it will show the items that have QOH < 6.
- Only Items >= X: Selecting this option will generate a report displaying items with Quantity on Hand (QOH) values greater than or equal to the amount you specified. In this example, it will show the items that have QOH >= 6.
- Only Items <= X: Selecting this option will generate a report displaying items with Quantity on Hand (QOH) values less than or equal to the amount you specified. In this example, it will show the items that have QOH >= 6.
- Only Items = X: Selecting this option will generate a report displaying items with Quantity on Hand (QOH) values equal to the amount you specified. In this example, it will show the items that have QOH = 6.
- Only Items <> X: Selecting this option will generate a report displaying items with Quantity on Hand (QOH) values greater than or less than the amount you specified. In this example, it will show the items that have QOH <> 6.
- Select the desired option from the drop-down, enter the appropriate value in the X Value field, choose the required options for other fields, and click "Generate Report."
4.3 Group By
Now, let's see how to check the Inventory Evaluation Report using different grouping options.
You can check the data in the Inventory Evaluation Report by dividing the group as well. You will have the following grouping options to generate the report in a group:
UPC | Departments | Category | Manufacturer | Tag | Department/Store Totals (See Figure 4.3.1)
4.3.1 Group By UPC
When you generate the Inventory Evaluation Report, by default, it will be generated with the "Group By UPC" pre-selection. The report will show the UPC (item)-wise sales data.
Figure 4.3.1
4.3.2 Group By Departments
If you select "Group By Departments," you will see the department-wise inventory data in the report. The items in the same department will be displayed under the specific department when you generate the Inventory Evaluation Report.
Figure 4.3.2
4.3.3 Group By Category
If you select "Group By Category," you will see the product's category-wise inventory data in the report. You can check the inventory data in the report at the category level. You need to select the level from the Category Depth drop-down selection. When you select "Group By Category," by default, "Show All" will be pre-selected.
Figure 4.3.3.1
- Category Depth: When you select "Group By Category," this drop-down option will be enabled. This drop-down option lists the level (depth) of the categories. So, by selecting the specific depth, the Inventory Evaluation Report will display only those inventory data under the selected depth (level).
4.3.4 Group By Manufacturer
If you select "Group By Manufacturer," you will see the manufacturer-specific inventory data in the report.
Figure 4.2.4
 Note: If the manufacturer is not assigned to the products, the inventory data for those products will be displayed under the Not Available group.
4.3.5 Group By Tag
If you select "Group By Tag," you will get the tag-wise inventory data in the group that is entered in the product details.
When you select "Group By Tag," the specific tag group will be enabled. Currently, you will see "All Tag Groups" by default.
When you select "Group By Tag," the specific tag group will be enabled. Currently, you will see "All Tag Groups" by default.
Figure 4.2.5
So, the inventory data will be grouped in the report based on the tags inserted in the product details.
4.3.6 Group By Department/Store Totals
If you select "Group By Departments/Store Totals," you will see the on-hand stock (QOH) total, along with Total Retail, Cost, and Margin ($) for the specific department.
Figure 4.3.6
4.4 Group By Location
You can filter the inventory report based on specific locations (stores). You will see a Group By Location drop-down from which you can select "Location."
By default, "None" will be pre-selected. It means the inventory report will be generated for all the stores (locations).
Figure 4.4.1
Once the location-specific report is generated, you can check the inventory data for the specific stores (locations) separately. So, you can check the total product stocks for a single store.
4.5 Filter Locations & Location Groups
You can generate the Inventory Evaluation Report by setting up the specific location and location group filters. For that, you will see the filter button for "locations" in the top-right corner.
Figure 4.5.1
By clicking that button (for the filter location), a Manage Filters window will pop up. You will see the following details: (See Figure 4.5.2 below.)
- Select the saved custom filter from the drop-down selection. The "Manage Filters" button will open the list of the saved custom filters.
- You will see the two tabs: "Store" and "Location Group"
- You can see the list of stores (locations) along with the checkbox. If there is a long list of stores, you can easily search by entering the name in the Search text box. Select the record(s) by ticking the checkbox.
- Once you select the stores from the list, click on the green right-sided arrow (the Move button) to move the store records to the Selected List.
Figure 4.5.2
By clicking the Move button, the selected stores will be moved to Selected List, which means the inventory report will consider the inventory data of the selected stores.
You can remove any store from the list by clicking the Remove (x) icon. If you want to remove the whole selection, click the "Clear Selection" button. (See Figure 4.5.3 below.)
Figure 4.5.3
Similarly, you can select the required location group(s) by navigating to the "Location Group" tab. Once the specific records are selected from the filter options (tabs), you can generate the Inventory Evaluation Report by clicking the "Apply" button and then the "Generate Report" button from the main page.
Figure 4.5.4
You can save it as a filter record for future use by clicking the "Save Filters" button. When you click the "Save Filters" button, a pop-up will appear asking you to enter the name of the location filter. (See Figure 4.5.5 below.)
Figure 4.5.5
Saved Filter: The saved custom filters will appear in the drop-down selection. You can select the required custom filter from the list to generate the Inventory Evaluation Report.
Figure 4.5.6
Manage Filters:
You can check and manage the filters by clicking the "Manage Filters" button. By clicking on it, you will see a listing of the saved custom filters in a pop-up.
Figure 4.5.7
- Select Filter: Select any filter from the list to generate the desired Inventory Evaluation Report. You need to select the filter from the list and then click on the "Select Filter" button.
- Delete: You can delete any filter from the list that is no longer required. Select the filter and then click on the "Delete" button.
When you set up the filters for locations (stores) & location groups, by hovering the mouse cursor over the filter button, you will see the selected details.
Figure 4.5.8
In this way, the location-specific custom filter options help to customize the data for the Inventory Evaluation Report by selecting specific stores (locations) and/or location groups.
 Note: "4.4 Group By Location" will group the inventory data based on locations, while the "4.5 Locations & Location Groups" custom filter option sets up a specific data selection, and the inventory data will be generated in the report as per the selected locations (stores) and/or location groups only.
4.6 Sort By
You will get the sorting option to sort the report data in ascending or descending order and apply it to the product name or UPC.
By clicking the "Sort By" option, you will see the four options to sort the inventory data accordingly.
Name Ascending | Name Descending | UPC Ascending | Descending
Figure 4.6.0
5. Show QOH As
The Show QOH As filter lets you filter the report records based on three parameters: By Product, Rollup Links, and By Vendor Part. When you click the Show QOH As drop-down, the options appear, as Figure 5.1 shows.
By default, the system selects "By Product" and generates the report accordingly, as shown in Figure 3.1 in point 3. Generating the Inventory Evaluation.
Figure 5.1
- Rollup Links: This filter will merge the related parent and child items to give you the total quantity on hand of the product in decimal format.
Figure 5.2
- By Vendor Part: Choosing this option will display the QOH (stock available for each part) in X Part/Y Units where "X" is the full parts and "Y" is the part num unit (subunit) in the report. The number of columns may vary as per the filters selected.
Figure 5.3
6. Checkbox Filters
You can enable the required options for the inventory report that are provided with the checkboxes. When you select the Inventory Evaluation Report, you will see the pre-selected filter and bifurcate options by default. You will see "Show Cost" and "Show Price" pre-selected.
Figure 6.1
6.1 Show Details
Tick the "Show Details" checkbox to display the products on the list. By ticking the "Show Details" checkbox and generating the report, you will see the products with the quantities on hand in the Inventory Evaluation Report.
Figure 6.1.1
You will see the Hyperlinked UPC which, when clicked, opens up the respective Product's Edit page. Along with that, Vendor Part Num, Available Stocks (QOH), Profit ($), and Margin (%) are displayed in the Inventory Evaluation Report.
6.2 Show Cost
Tick the "Show Cost" checkbox to check the cost of each product. By ticking the "Show Cost" checkbox and generating the report, the two columns, Cost Each and Total Cost will be displayed in the Inventory Evaluation Report.
Figure 6.2.0
The Cost Each column shows the cost of each product, and the Total Cost column shows the total cost as per available stocks (QOH) for each product.
6.3 Show Price
Tick the "Show Price" checkbox to check the retail price of each product. By ticking the "Show Price" checkbox and generating the report, the two columns Retail Each and Total Retail will be displayed in the Inventory Evaluation Report.
Figure 6.3.1
The Retail Each column shows the applicable retail price of each product, and the Total Retail column shows the total amount of retail price as per available stocks (QOH) for each product.
If you have selected the "Show Cost" and/or "Show Price" checkboxes only, you will see the overall Total Retail and/or Total Cost with total stocks (QOH) and Margin ($) in the Inventory Evaluation Report. Figure 6.3.2
6.4 Adjust Buydown from Cost & Price
When you enable the “Adjust Buydown from Cost & Price” checkbox and generate the report, the system will display inventory values with the buydown applied to both cost and price.
If the checkbox is unchecked, the Inventory Evaluation Report will show the original cost and retail price for each product, without any buydown adjustments.
Figure 6.4.1
When the "Adjust Buydown from Cost & Price" checkbox is enabled, you can see the applicable cost and retail price after adjusting the buydowns in the inventory data.
Figure 6.4.2
The buydown is adjusted as per configuration from Pricebook -> Discounts/Buydowns -> Buydowns.
6.5 Skip Fallback to Last Cost
"Skip Fallback to Last Cost" prevents the system from using the item’s last cost when a current cost is missing. When this box is checked, items with no current cost will show zero/blank cost instead of falling back to the last cost, which may result in zero or N/A profit and margin values.
Figure 6.5.1
6.6. Snapshot Report
- By ticking the "Snapshot Report" checkbox, you can check the inventory QOH details for a specific date. Once you tick the "Snapshot Report" checkbox, the date selection will be visible.
- Select the date and generate the report to check the inventory-QOH details for that specific date.
Figure 6.6.1
Once the report is generated, you can see the snapshot report data as per the selection of the other filters and checkboxes.
7. Scheduling a Report
FTx Cloud POS supports report automation. You can configure a report and schedule it. The system will send the scheduled report to the indicated email addresses at the defined frequencies (daily, weekly, bi-weekly, monthly, quarterly, etc.).
8. Printing/Exporting a Report
You can print or export any report according to your requirements. When you use the Print function, the system creates and opens the report's PDF file in a new tab. You can download the soft copy or print the paper copy according to your requirements.
9. Manage Favorites
FTx Cloud POS allows quick access to the reports you need to view frequently through "Favorite Reports." You can save a report as a favorite and manage all your favorite reports from any of the report screens using the "Manage Favorites" button.
Related Articles
Inventory Evaluation Report - Store Employee
Inventory Evaluation Report Overview To effectively monitor product inventory, inventory reports must provide insights into available stock, total cost, and retail price. FTx Cloud POS offers a variety of inventory reports that present comprehensive ...House Account Balance Report
House Account Balance Report Overview Regular customers or businesses who make frequent purchases and settle their total balance at the end of the month or at a designated time interval can be categorized as "House Accounts" in Control Center. ...Cycle Count Coverage Report
Cycle Count Coverage Report Overview Reports -> Inventory Reports -> "Cycle Count Coverage" The store admin/executive manages the inventory of the store using a POS system handheld device to count the inventory periodically. At the time of counting ...Cycle Count Coverage Report - Store Employee
Cycle Count Coverage Report Overview The store employees manage the inventory of the store using a POS system handheld device to count the inventory periodically. At the time of counting the inventories, all the actions are tagged with a timestamp, ...Inventory Projection Report
Inventory Projection Report Overview Inventory Projection, also referred to as inventory forecasting or demand planning, involves analyzing past inventory data and trends to make informed decisions for future inventory management. This report type ...