Item Reports
1. Overview
The "Item Report" is a detailed summary that tracks all transactions associated with a specific campaign within a selected date range. This report provides information about the performance of the campaign by listing every transaction that occurred because of the campaign's promotions or deals. Retailers can use this report to assess how effectively the campaign influenced sales, allowing them to analyze customer engagement, understand which products were most impacted by the campaign, and refine future promotional strategies based on this data.
2. Reaching the "Item Reports" section
To reach an "Item Reports" section in Control Center, perform the following:
- Step 1: Log into Control Center
- Step 2: Choose Loyalty
- Step 3: Choose Reports
- Step 4: Choose Item Reports
Figure 1.0
You will see many types of item reports that will be useful to your retail business. By clicking the drop-down selection, you will see the different types of item reports.
Figure 1.1
3. Campaign Items Report
This report tracks all transactions tied to a specific campaign during a selected date range. Retailers can use this report to evaluate the success of a campaign by analyzing which items were sold under the campaign and how much revenue those items generated. It's particularly useful for assessing campaign performance and customer engagement.
You can generate and view the report according to your preferences using various filter options. You can configure the report with any single filter or a combination of multiple filters.
The available filters for Campaign Items Report are as follows:
- Gender Filter: This filter offers you different gender-based options to display the report accordingly.
- All: This option, when chosen, will display a report for all genders.
- Male: If this option is chosen, it will display a report for male customers.
- Female: If this option is chosen, it will display a report for female customers.
- Date Range & Presets: This filter lets you select the report's time interval.
- Click inside the Start Date field.
- Select the specific date and time from the drop-down calendar. You can also manually enter the date in the MM/DD/YYYY format.
- Click inside the End Date field and follow the same process.
- Filter By Items: The Filter Items filter lets you view the report based on a selected parameter from five options: UPC, Department, Category, Manufacturer, and Tag. This means you can access the report for specific items (UPCs), departments, or any other parameter.
- The Filter Items drop-down menu has two options: Show All and Custom Filter. By default, the system selects "Show All" and considers all parameters to generate the report. The "Custom Filter" lets you view the report based on a specified parameter from five available options: UPC, Department, Category, Manufacturer, and Tag.
Follow the steps below to make the required selections:
- Select the Custom Filter option in the Filter Items drop-down and click the "Manage" button.
Figure 1.2
- 1: Saved Filters Drop-Down: Select the saved custom filters from the Manage Filters drop-down (if any) and click "Apply" to apply the saved custom filter. The system will redirect you to the Campaign Item Report home screen. Click "Generate Report" to generate the report for the selected filter.
- 2: Manage Filters: Clicking on this button will also open the Manage Saved Filters screen.
- 3: Parameters Tabs: You will see five tabs: UPC, Department, Category, Manufacturer, and Tag. Select the required tab, i.e., "UPC," to create or apply a custom filter specific to the selected UPCs.
- 4: Search: Use this Search box for a specific result.
- 5: All Items: Use the All Items drop-down to filter the Manage Filters screen data based on four product parameters: All Items, Child Only, Parent Only, and Standalone Only. Choose the required parameter. This filter is available only for the UPC tab.
- 6: Active Only: Use this filter to filter the Manage Filters screen data based on three product parameters: Active Only, Inactive Only, and All Records. This filter is available only for the UPC tab.
- 7: Match All Filters Drop-Down: Use the Match All Filters filter to decide whether or not the Manage Filters screen data matches all applied filters.
- 8: Results: Here, you see the relevant list of data on the Manage Filters screen for the selected tab. For example, if you have chosen the UPC tab, it will show the list of all UPCs. You can use the "Search" bar for a specific UPC.
- 9: Selection Checkboxes: Select the required UPCs by checking the appropriate checkboxes.
- 10: Arrow: Click the Green Arrow button to move the selected records to Selected Area.
Figure 1.3
- Include or Exclude Toggle Button: When generating the report, you can decide whether to include or exclude the selected parameters.
- Include: If you select "Include," the system will include all the specified parameters to generate the report.
- Exclude: If you select "Exclude," the system will exclude all the specified parameters to generate the report.
- Click the "Clear Selection" button to remove the whole selection. To remove any single record from the list, click the Remove (x) icon next to the record.
- Apply: Click the "Apply" button for the selected parameters.
- Save Filters: Click the "Save Filters" button to save the custom filter for future use.
Filter By Customer: You can filter the report data by selecting specific customers from the list to check the items they got when buying the products. By clicking Filter By Customers from the Filter By Customer drop-down, a Manage Filters window will open from where you can select the specific customer. You can select a specific customer from the available list and generate the report.
Order By: This field will let you sort the report in different ways.
- Department, Item Name Ascending
- Total Reward Tokens Ascending
- Total Reward Tokens Descending
Group By Location: Allows you to check the Campaign Items Report by grouping it by location or location group. You will see a "Group By Location" drop-down from which you can select either "Location" or "Location Group" for grouping the report. By default, None will be pre-selected, which means the data will be displayed without any grouping.
- Location: If you select "Location," the report will be generated, and the data will be displayed in the grouping according to the locations (stores) individually.
- Location Group: When you select "Location Group," one more filter option will be enabled to select the specific location group(s). You can see the "Include Location Group(s)" drop-down option to check the data for the specific location group.
Select Campaign: This field will let you sort the report according to the selected campaign.
Exclude Employees: This option filters out transactions made by employees from the report. Since employees might receive discounts or buy items for reasons different from regular customers, excluding them can provide a clearer picture of customer behavior without skewed data from internal purchases.
Below is the generated output of Campaign Items Reports:
Figure 1.4
Below is a breakdown of each field in the Campaign Items Report:
- Department Name: Represents the department to which the item belongs (e.g., Beverages, Snacks, Electronics).
- Item Name: Displays the name of the item that was part of the campaign and sold during the selected date range.
- UPC (Universal Product Code): A unique code assigned to the item for identification and tracking.
- Customer Name: Shows the name of the customer who made the purchase.
- Receipt #: A unique receipt number for the transaction in which the campaign item was sold.
- Timestamp: Indicates the exact date and time when the transaction occurred.
- Total Tokens: The total number of loyalty tokens earned by the customer from the transaction.
4. Customer Item Report
This report details every item a customer has purchased within a specific date range, including the quantity purchased. It also provides access to individual receipts by clicking on the customer’s name in the Item Summary mode. This report is valuable for customer analysis, enabling retailers to understand individual purchasing behaviors. It can help identify loyal customers, understand their preferences, and tailor future campaigns or offers accordingly.
You can generate and view the report according to your preferences using various filter options. You can configure the report with any single filter or a combination of multiple filters.
The available filters for the Customer Items Report are as follows:
Report Type:
- Item Summary: This report includes key metrics such as the total number of items sold, revenue generated, and the overall contribution of each item to sales within a specific period. It helps in identifying best-selling items, tracking inventory levels, and analyzing trends in product popularity.
- Item Transaction Detail: This report breaks down each transaction involving specific items, including details like transaction date, customer information, quantity sold, discounts applied, and loyalty points awarded or redeemed. It is useful for tracking individual sales events and understanding customer purchasing behavior.
- Email List Output: This report compiles email addresses of customers who have engaged with the program, often segmented by criteria such as recent purchases, participation in promotions, or loyalty tier status.
Gender Filter: This filter offers you different gender-based options to display the report accordingly.
- All: This option, when chosen, will display a report for all genders.
- Male: If this option is chosen, it will display a report for male customers.
- Female: If this option is chosen, it will display a report for female customers.
Date Range & Presets: This filter lets you select the report's time interval.
- Click inside the Start Date field.
- Select the specific date and time from the drop-down calendar. You can also manually enter the date in the MM/DD/YYYY format.
- Click inside the End Date field and follow the same process.
Filter By: This filter lets you view the report based on a selected parameter from five options: UPC, Department, Category, Manufacturer, and Tag. This means you can access the report for specific items (UPCs), departments, or any other parameter.
The Filter By drop-down menu has two options: Show All and Custom Filter. By default, the system selects "Show All" and considers all parameters to generate the report. "Custom Filter" lets you view the report based on a specified parameter from five available options: UPC, Department, Category, Manufacturer, and Tag.
Follow the steps below to make the required selections:
- Select the Custom Filter option in the Filter By drop-down and click the "Manage" button.
Figure 1.5
- 1: Saved Filters Drop-Down: Select the saved custom filters from the Manage Filters drop-down (if any) and click "Apply" to apply the saved custom filter. The system will redirect you to the Campaign Item Report home screen. Click "Generate Report" to generate the report for the selected filter.
- 2: Manage Filters: Clicking on this button will also open the Manage Saved Filters screen.
- 3: Parameters Tabs: You will see five tabs: UPC, Department, Category, Manufacturer, and Tag. Select the required tab, i.e., "UPC," to create or apply a custom filter specific to the selected UPCs.
- 4: Search: Use this Search box for a specific result.
- 5: All Items: Use the All Items drop-down to filter the Manage Filters screen data based on four product parameters: All Items, Child Only, Parent Only, and Standalone Only. Choose the required parameter. This filter is available only for the UPC tab.
- 6: Active Only: Use this filter to filter the Manage Filters screen data based on three product parameters: Active Only, Inactive Only, and All Records. This filter is available only for the UPC tab.
- 7: Match All Filters Drop-Down: Use the Match All Filters filter to decide whether or not the Manage Filters screen data matches all applied filters.
- 8: Results: Here, you see the relevant list of data on the Manage Filters screen for the selected tab. For example, if you have chosen the UPC tab, it will show the list of all UPCs. You can use the "Search" bar for a specific UPC.
- 9: Selection Checkboxes: Select the required UPCs by checking the appropriate checkboxes.
- 10: Arrow: Click the Green Arrow button to move the selected records to Selected Area.
- Include or Exclude Toggle Button: When generating the report, you can decide whether to include or exclude the selected parameters.
- Include: If you select "Include," the system will include all the specified parameters to generate the report.
- Exclude: If you select "Exclude," the system will exclude all the specified parameters to generate the report.
- Click the "Clear Selection" button to remove the whole selection. To remove any single record from the list, click the Remove (x) icon next to the record.
- Apply: Click the "Apply" button for the selected parameters.
- Save Filters: Click the "Save Filters" button to save the custom filter for future use.
Filter By Customer: You can filter the report data by selecting specific customers from the list to check the items they got when buying the products. By clicking Filter By Customers from the "Filter By Customer" drop-down, a Manage Filter window will open from where you can select the specific customer. You can select a specific customer from the available list and generate the report.
Order By:
- Highest Sale Qty: Sorts the report data based on the quantity of items sold, from highest to lowest.
- Signup Date Descending: Sorts the report data by the date customers signed up for the Loyal-n-Save program, starting with the most recent signups.
- Signup Date Ascending: Sorts the report data by the date customers signed up for the Loyal-n-Save program, starting with the earliest signups.
- Total Reward Tokens Descending: Sorts the report data based on the total reward tokens earned by customers, from the highest to the lowest.
- Total Reward Tokens Ascending: Sorts the report data based on the total reward tokens earned by customers, from the lowest to the highest.
Group By Location: Allows you to check the Campaign Item Report by grouping it by location or location group. You will see a "Group By Location" drop-down from which you can select either "Location" or "Location Group" for grouping the report. By default, None will be pre-selected, which means the data will be displayed without any grouping.
- Location: If you select "Location," the report will be generated, and the data will be displayed in the grouping according to the locations (stores) individually.
- Location Group: When you select "Location Group," one more filter option will be enabled to select the specific location group(s). You can see the "Include Location Group(s)" drop-down option to check the data for the specific location group.
Group By Age Range: This option allows you to categorize and analyze customer purchasing data based on different age brackets.
Exclude Employees: This option filters out transactions made by employees from the report. Since employees might receive discounts or buy items for reasons different from regular customers, excluding them can provide a clearer picture of customer behavior without skewed data from internal purchases.
Below is the generated output of the Customer Items Report:
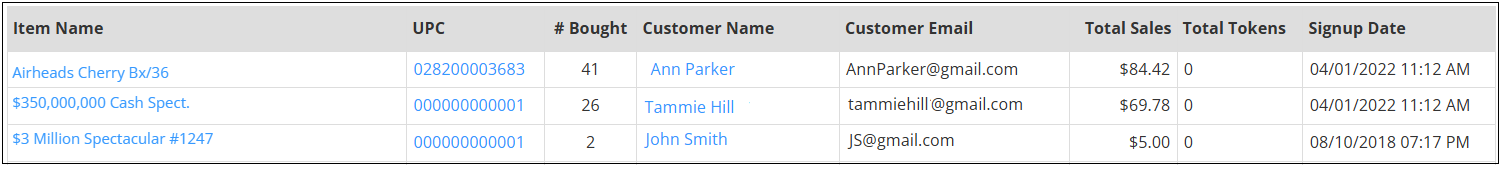
Figure 1.6
Below is a breakdown of each field in the Customer Items Report:
- Item Name: Represents the name of the product that the customer purchased within the specified date range.
- UPC: A unique code assigned to the item for identification and tracking.
- # Bought: Indicates the total quantity of the item purchased by the customer during the selected date range.
- Customer Name: Displays the name of the customer who made the purchase.
- Customer Email: Shows the email address associated with the customer’s loyalty account.
- Total Sales: Represents the total revenue generated from the customer's purchases of the item.
- Total Token: The total number of loyalty tokens earned by the customer from purchasing the item.
5. Customer Top Balance Earning Items Report
This report identifies the top customers who have earned the most tokens within a specified date range. This report not only highlights these high-earning customers but also details the specific products they purchased that contributed to their token earnings, bonus type, quantity sold, and balance added. Retailers can use this report to recognize their most engaged and valuable customers, providing insights into which products drive the most loyalty.
You can generate and view the report according to your preferences using various filter options. You can configure the report with any single filter or a combination of multiple filters.
The available filters for the Customer Top Balance Earning Report are as follows:
Date Range & Presets: This filter lets you select the report's time interval.
- Click inside the Start Date field.
- Select the specific date and time from the drop-down calendar. You can also manually enter the date in the MM/DD/YYYY format.
- Click inside the End Date field and follow the same process.
Show Records: This option allows you to limit the report to display only the top customers based on their balance earnings within the selected period. By choosing options like Top 10, Top 25, or Top 50, you can quickly view and analyze the highest earners among your customer bases.
Below is the generated output of the Customer Top Balance Earning Items Report:
Figure 1.7
Below is the breakdown of the Customer Top Balance Earning Items Report:
- Product Name: Represents the name of the product purchased by the customer that contributed to earning tokens.
- UPC: A unique code assigned to the item for identification and tracking.
- Customer: Displays the name of the customer who earned tokens from purchasing the product.
- Bonus Type: Indicates the type of loyalty bonus associated with the product.
- Amount: Represents the total amount earned from purchasing the specific product.
- Sold Qty: Shows the total quantity of the product sold during the selected date range.
- Balance Added: The total number of tokens added to the customer’s loyalty balance as a result of purchasing the product.
6. Item Total Earnings Report
This report highlights the items that earned the most or least tokens within a specified date range. It provides details on the money spent on each item, the quantity sold, and the tokens awarded. Retailers can use this report to identify which products are driving token earnings, allowing them to focus on promoting high-earning items or reconsider the strategy for low-earning ones. It's a critical tool for refining loyalty strategies.
You can generate and view the report according to your preferences using various filter options. You can configure the report with any single filter or a combination of multiple filters.
The available filters for the Item Total Earnings Report are as follows:
Date Range & Presets: This filter lets you select the report's time interval.
- Click inside the Start Date field.
- Select the specific date and time from the drop-down calendar. You can also manually enter the date in the MM/DD/YYYY format.
- Click inside the End Date field and follow the same process.
Filter By: This filter lets you view the report based on a selected parameter from five options: UPC, Department, Category, Manufacturer, and Tag. This means you can access the report for specific items (UPCs), departments, or any other parameter.
The Filter By drop-down menu has two options: Show All and Custom Filter. By default, the system selects "Show All" and considers all parameters to generate the report. "Custom Filter" lets you view the report based on a specified parameter from five available options: UPC, Department, Category, Manufacturer, and Tag.
Follow the steps below to make the required selections:
- Select the "Custom Filter" option in the Filter By drop-down and click the "Manage" button.
- 1: Saved Filters Drop-Down: Select the saved custom filters from the Manage Filters drop-down (if any) and click "Apply" to apply the saved custom filter. The system will redirect you to the Campaign Item Report home screen. Click "Generate Report" to generate the report for the selected filter.
- 2: Manage Filters: Clicking on this button will also open the Manage Saved Filters screen.
- 3: Parameters Tabs: You will see five tabs: UPC, Department, Category, Manufacturer, and Tag. Select the required tab, i.e., "UPC," to create or apply a custom filter specific to the selected UPCs.
- 4: Search: Use this Search box for a specific result.
- 5: All Items: Use the All Items drop-down to filter the Manage Filters screen data based on four product parameters: All Items, Child Only, Parent Only, and Standalone Only. Choose the required parameter. This filter is available only for the UPC tab.
- 6: Active Only: Use this filter to filter the Manage Filters screen data based on three product parameters: Active Only, Inactive Only, and All Records. This filter is available only for the UPC tab.
- 7: Match All Filters Drop-Down: Use the Match All Filters filter to decide whether or not the Manage Filters screen data matches all applied filters.
- 8: Results: Here, you see the relevant list of data on the Manage Filters screen for the selected tab. For example, if you have chosen the UPC tab, it will show the list of all UPCs. You can use the "Search" bar for a specific UPC.
- 9: Selection Checkboxes: Select the required UPCs by checking the appropriate checkboxes.
- 10: Arrow: Click the Green Arrow button to move the selected records to Selected Area.
Figure 1.8
- Include or Exclude Toggle Button: When generating the report, you can decide whether to include or exclude the selected parameters.
- Include: If you select "Include," the system will include all the specified parameters to generate the report.
- Exclude: If you select "Exclude," the system will exclude all the specified parameters to generate the report.
- Click the "Clear Selection" button to remove the whole selection. To remove any single record from the list, click the Remove (x) icon next to the record.
- Apply: Click the "Apply" button for the selected parameters.
- Save Filters: Click the "Save Filters" button to save the custom filter for future use.
Show Records: This option allows you to limit the report to display only the top customers based on their balance earnings within the selected period. By choosing options like Top 10, Top 25, or Top 50, you can quickly view and analyze the highest earners among your customer bases.
Order By (Highest Token Total, Lowest Token Total): This option determines how the items in the report are sorted based on the total tokens earned.
- Highest Token Total: This will sort the items in descending order, showing the items that have generated the most tokens at the top of the report. It's useful for identifying the most popular or rewarding items in your inventory.
- Lowest Token Total:
This will sort the items in ascending order, displaying the items that have earned the fewest tokens first. This can help identify items that are less popular or not generating as much engagement in your loyalty program.
Below is the generated output of Item Total Earning Report:
Figure 1.9
Below is the breakdown of the Item Total Earning Report:
- Product Name: Represents the name of the item that contributed to earning loyalty tokens.
- UPC: A unique code assigned to the item for identification and tracking.
- Amount: The total monetary value generated from the sales of the item within the specified date range.
- Sold Qty: The total number of units of the item sold during the specified period
- Balance Added: The total number of loyalty tokens awarded for purchasing the item.
7. Swag Shop Items Report
The Swag Shop Report provides a comprehensive analysis of the shop's performance over a specific period. This report aims to offer a comprehensive overview of the items purchased by customers, including physical products and digital coupons.
The available filters for the Swag Shop Item Report are as follows:
- Gender Filter: This filter offers you different gender-based options to display the report accordingly.
- All: This option, when chosen, will display a report for all genders.
- Male: If this option is chosen, it will display the report for male customers.
- Female: If this option is chosen, it will display the report for female customers.
- Filter by Time: This filter is used to fetch the report for the selected date range or period.
- All Time: This is the default setting. It will generate a report of all the items by date.
- Between Dates: This option will allow you to select a specific date range. To select the date range, input the Start Date and End Date with the associated drop-down calendars.
- Presets: The Presets label is provided to select the specific duration/interval to generate the report with that.
- Item Type: This filter is used to fetch the report based on the selected item type.
- All Items: Choosing this option will generate the report of both merchandise and coupon reports.
- Merchandise: Choosing this option will generate the report of physical products.
- Coupon: Choosing this option will generate the report of digital coupons.
- Coupon Type
- All: Choosing this option will generate the report of all coupon types.
- Dollar Amount Off: Choosing this option will generate the report for those items on which dollar amount off is applied.
- Free Item: Choosing this option will generate the report for those items on which the free item offer is applied.
- Filter By Customer: This filter option will filter the report by customer. Select the customer's name from the list, and the report will be displayed only with the customer's name.
- Show All: This is the default setting. It will generate a report on all customers.
- Filter by Customer Filter (Manage): If you would like to look at a specific customer, select this option. Once you click on this option, the "Manage" button will be enabled to set up the filters. You can select a customer or multiple customers to be brought up in the report. By clicking the "Manage" button, a Manage Filters window will pop up.
- You will see different customer names to select the items for the Swag Shop Report.
- Click the checkbox next to whichever customer(s) you wish to see on the report to move them to the Selected List area on the right side.
- Once you select the records from the list, click on the green right-sided Arrow (Move/Next button) to move the records to the Selected List area.
- By clicking the Move button, the selected records will be moved to the Selected List.
- Once you click on "Apply." The Swag Shop Report will be generated with the selected records only.
- Order By: This field will let you sort the report in 10 different ways.
- Redemption Date Descending: Select this option to sort and display the report with Token Redemption Dates from newest to oldest.
- Redemption Date Ascending: Select this option to sort and display the report with Token Redemption Dates from oldest to newest.
- Item Name Descending: This option will sort the item Names in descending alphabetical order and display the report based on this arrangement.
- Item Name Ascending: This option will sort the item Names in ascending alphabetical order and display the report based on this arrangement.
- Customer Email Descending: This option will sort the Customer Email in descending alphabetical order and display the report based on this arrangement.
- Customer Email Ascending: This option will sort the Customer Email in ascending alphabetical order and display the report based on this arrangement.
- Total Tokens Descending: This option will sort the Total Tokens in descending order (from higher to lower) and display the report based on this arrangement.
- Total Tokens Ascending: This option will sort the Total Tokens in ascending order (from lower to higher) and display the report based on this arrangement.
- Delivered Date Descending: This option sorts the report by delivered dates in descending order, displaying the most recent dates first.
- Delivered Date Ascending: This option sorts the report by delivered dates in ascending order, displaying the earliest dates first.
- Filter By Column: This field will let you filter the report in two different ways:
- Item Name
- Barcode
Once you select Item Name/Barcode, the option to enter the value will be displayed.
Generating the Swag Shop Items Report
When you navigate to the "Swag Shop Items" page, you need to select the filters and generate the report. Once the report is generated, the following fields will contain the requested information:
- Item Name: This column describes the name of the item.
- Item Type: This column describes whether the item is a coupon or merchandise.
- UPC: This column describes the product UPC, which is generally N/A for the coupon.
- Barcode: This column describes the barcode number of the item.
- Customer Name: This column describes the customer's name.
- Customer Email: This column describes the customer's email address.
- Total Tokens: This column describes the total number of tokens redeemed by the customer.
- Token Redemption Date: This column describes the date on which the token was redeemed.
- Value delivered Date: This column describes the date on which the coupon is redeemed from POS.
Below is the generated output of the Swag Shop Items Report:
Figure 2.0
8. Top Earning Items Report
This report lists the top token-earning products during a given period. By identifying which products are most popular in terms of token earnings, retailers can optimize inventory, marketing, and promotions to boost sales and enhance the effectiveness of the loyalty program. You can generate and view the report according to your preferences using various filter options. You can configure the report with any single filter or a combination of multiple filters.
The available filters for the Top Earning Items Report are as follows:
Filter By: This filter lets you view the report based on a selected parameter from three options: Department, Category and Manufacturer. This means you can access the report for specific items Departments, Category or Manufacturer parameter.
The Filter By drop-down menu has two options: Show All and Custom Filter. By default, the system selects "Show All" and considers all parameters to generate the report. "Custom Filter" lets you view the report based on a specified parameter from three available options: Department, Category, and Manufacturer.
Follow the steps below to make the required selections:
- Select the Custom Filter option in the Filter By drop-down and click the "Manage"
button.
Figure 2.1
1: Saved Filters Drop-Down: Select the saved custom filters from the Manage Filters drop-down (if any) and click "Apply" to apply the saved custom filter. The system will redirect you to the Campaign Item Report home screen. Click "Generate Report" to generate the report for the selected filter.
2: Manage Filters: Clicking on this button will also open the Manage Saved Filters screen.
3: Parameters Tabs: You will see three tabs: Department, Category, Manufacturer.
4: Search: Use this Search box for a specific result.
5: Match All Filters Drop-Down: Use the Match All Filters filter to decide whether or not the Manage Filters screen data matches all applied filters.
6: Results: Here, you see the relevant list of data on the Manage Filters screen for the selected tab.
7: Selection Checkboxes: Select the required department by checking the appropriate checkboxes.
8: Arrow: Click the Green Arrow button to move the selected records to Selected Area.
Figure 2.2
- Include or Exclude Toggle Button: When generating the report, you can decide whether to include or exclude the selected parameters.
- Include: If you select "Include," the system will include all the specified parameters to generate the report.
- Exclude: If you select "Exclude," the system will exclude all the specified parameters to generate the report.
- Click the "Clear Selection" button to remove the whole selection. To remove any single record from the list, click the Remove (x) icon next to the record.
- Apply: Click the "Apply" button for the selected parameters.
- Save Filters: Click the "Save Filters" button to save the custom filter for future use.
- Show Top: This option allows you to limit the report to display only the top-performing items based on their total earnings. By selecting options like Top 10, Top 25, or Top 50, you can focus on the most successful items in terms of tokens earned.
- Date Range & Presets: This filter lets you select the report's time interval.
- Click inside the Start Date field.
- Select the specific date and time from the drop-down calendar. You can also manually enter the date in the MM/DD/YYYY format.
- Click inside the End Date field and follow the same process.
Below is generated output of the Top Earning Items Report:
Figure 2.3
Below is a breakdown of Top Earning Items Report:
- Product Name: Represents the name of the product that generated the highest token earnings during the specified period.
- UPC: A unique code assigned to the item for identification and tracking.
- Earned Amount (Tokens): The total number of loyalty tokens earned from the sales of the product during the specified period.
- Avg Amount (Tokens): The average number of tokens earned per sale of the product.
- Earned Amount ($): The total revenue generated from the sales of the product within the given period.
- # Customers: The total number of unique customers who purchased the product during the specified period.
- # Campaigns: The number of marketing campaigns in which the product was included.
- Most Used Campaign: The campaign that most frequently involved this product or generated the most token earnings from the product.
Related Articles
Campaign Reports
1. Overview A Campaign Report is designed to generate comprehensive reports on various campaign-related statistics. This feature allows businesses to analyze and evaluate the performance of their marketing campaigns by providing detailed insights ...Customer Reports
1. Overview "Customer Reports" provides a comprehensive set of customer reports that allow businesses to analyze and manage customer behavior, engagement, and loyalty activities effectively. 2. Reaching "Customer Reports" To reach "Customer Reports" ...Employee Reports
Employee Reports Reaching "Employee Reports" To reach "Employee Reports" in Control Center, perform the following: Step 1: Log into Control Center Step 2: Choose Loyalty Step 3: Choose Reports Step 4: Choose Employee Reports Figure 1.0 Filters The ...Store Reports
Overview To reach the "Store Reports" in Control Center, perform the following: Step 1: Log into Control Center Step 2: Choose Loyalty Step 3: Choose Reports Step 4: Choose Store Reports Figure 1.0 Store Monthly Signup Report: This report provides a ...Item Simulator
1. Overview The "Campaign Item Simulator" allows users to validate how specific products will behave within a campaign. It provides a detailed breakdown of reward calculations based on selected items and locations. 2. Reaching the "Campaign Item ...