Location Sales Report - Store Employee
Location Sales Report Overview
The "Location Sales Report" in FTx Cloud POS summarizes the sales performance of the selected store location.
This article includes information about:
- How to generate the Location Sales Report for the selected date range
- How to apply filter options to customize the report
- How to automate (schedule) or print a report
- How to mark the report as a favorite report
1. Reaching the "Location Sales Report"
- Step 1: Log into Control Center
- Step 2: Choose Store
- Step 3: Choose Reports
- Step 4: Choose Sales Reports
- Step 5: Choose Location Sales
Figure 1.1 below will help you better understand the navigation.
Figure 1.1
When you click "Location Sales," the Location Sales Report screen will open. As shown in Figure 1.2, it provides relevant filtering and sorting options.
Figure 1.2
2. Generating the "Location Sales Report"
Please follow the steps below to generate the Location Sales Report that meets your requirements.
- Navigate to the Location Sales Report screen.
- You can view the Location Sales Report for a specific date range by selecting a date range and clicking "Generate Report."
- You can use the Filter Items (Custom Filters), Sort By, Date Range & Presets, Return Filter, Include In Sales Reporting, and Filter the Sales By filters to create the report that meets your requirements. You can use multiple filters to make the report more specific. Please refer to point 3. Report Filter Options to learn more about these filters.
- Click "Generate Report" whenever you change your selection in any field to view the updated report.
- When you click the "Generate Report" button after selecting the date range, the system will show the location-wise report, as Figure 2.1 shows.
Figure 2.1
Report Fields:
- Location: This column displays the name of the store's physical location.
- Sale Count: The value of the sale count at that particular store.
- Qty Sold: This column displays the total value of the item quantities sold at that store in the selected date range.
- Total Retail: This column displays the total retail value generated by that store in the selected date range.
- Discounts: This column mentions the value of all the discounts applied in the selected date range at that particular store. The value is negative because the discount reduces the gross amount or value of the items sold.
- Adj Retail (Adjusted Retail): This column displays the adjusted retail value, calculated as the store's Total Retail value divided by its Discount Value.
- Avg Retail (Average Retail): This column describes the average retail sales value calculated as Total Retail/Qty Sold.
- Total Cost: This column displays the total cost (the price at which the item is bought) of the items sold at the location mentioned in the adjacent column in the selected date range.
- Buydowns: This column displays the buydown amount to keep track of money receivable from manufacturers who offer the customer a discount on some of their products.
- Adj Cost (Adjusted Cost): This column displays the location's total adjusted cost value in the selected date range, calculated as Total Cost-Buydowns.
- Avg Cost (Average Cost): This column describes the average cost, calculated using the Total Cost/quantity sold.
- $ Margin: This column describes the profit margin calculated by Adjusted Retail-Adjusted Cost.
- % Mgn: This column will define the margin percentage as Adjusted Retail Price-Adjusted Cost/Adjusted Retail Price x 100.
3. Report Filter Options
FTx Cloud POS lets you customize the Location Sales Report records according to your preferences using various filter options. You can configure the report with any single filter or a combination of multiple filters, as highlighted in Figure 3.1. 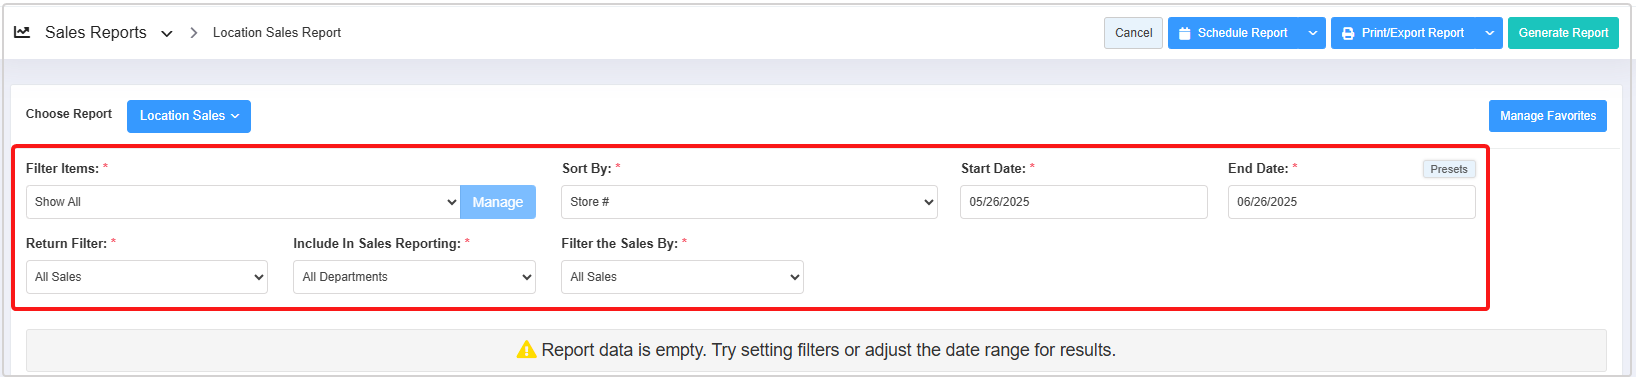
Figure 3.1
Report Filters:
- Filter Items: Filter Items lets you select the report data based on ten parameters: Department, Category, Manufacturer, Tag, Campaign, Commission, Discount, Buydown, Vendor, and Department Tag. 3.1 Filter Items (Custom Filters) explains the further details.
- Sort By: This filter lets you arrange the report records based on three parameters: the ascending order of the store number, the order of Total Retail from highest to lowest, and the order of the profit margin from highest to lowest. 3.2 Sort By explains the further details.
- Date Range & Presets: This filter lets you select the report's time interval. 3.3 Date Range & Presets explains further details.
- Return Filter: This filter lets you sort the sales records by three parameters: All Sales, Only Returns, and Exclude Returns. 3.4 Return Filter explains the further details.
- Include in Sales Reporting: This filter lets you filter the location sales records based on three parameters: All Departments, Only Include in Sales Reporting, and Not Include In Sales Reporting. 3.5 Include In Sales Reporting explains further details.
- Filter the Sales By: This filter lets you filter the report records based on three parameters: All Sales, E-Commerce Sales, and In-Store Sales. 3.6 Filter the Sales By explains the further details.
3.1 Filter Items (Custom Filters)
The Filter Items drop-down lets you select the report data using specific parameters. It has two selection options:
- Show All: The system selects "Show All" by default. It considers all parameters to generate the Location Sales Report for the selected locations. The "Manage" button is disabled for this option.
- Custom Filter: This option enables you to generate the report by selecting specific parameters such as Department, Category, Manufacturer, Tag, Campaign, Commission, Discount, Buydown, Vendor, and Department Tag. Once you choose "Custom Filter," the system will enable the "Manage" button to set up the filters.
Please follow the steps below to create and apply a custom filter:
- Select the Custom Filter option in the Filter Items drop-down and click the "Manage" button.
Figure 3.1.1
- The Manage Filters screen will appear, as Figure 3.1.2 shows.
Figure 3.1.2
- 1: Manage Filters Drop-Down: Select the saved custom filters from the Manage Filters drop-down (if any) and click "Apply" to apply the saved custom filter. The system will redirect you to the Location Sales Report home screen. Click "Generate Report" to generate the report for the selected filter. Clicking the "Manage Filters" button will also open the list of saved custom filters.
- 2: Manage Filters: Clicking this button will also open the Manage Saved Filters screen. Section 3.1.1, Save and Manage Custom Filters explains the details.
- 3: Parameter Tabs: You will see ten tabs: Department, Category, Manufacturer, Tag, Campaign, Commission, Discount, Buydown, Vendor, and Department Tag. Select the required tab, i.e., "Department," to create or apply a custom filter specific to the selected Departments.
- 4: Search: Use this "Search" box for a specific result.
- 5: Match All Filters Drop-Down: Use the Match All Filters filter to decide whether or not the Manage Filter screen data matches all applied filters. This drop-down is useful when you use multiple parameter tabs. For example, you choose a few manufacturers from the "Manufacturer" tab and a few departments from the "Department" tab.
- 6: Results: Here, you see the relevant list of data for the selected tab. For example, if you have chosen the "Department" tab, it will show the list of all departments. You can search for a specific department in the "Search" bar.
- 7: Selection Checkboxes: Select the required departments by checking the appropriate checkboxes.
- 8: Arrow: Click the green "Arrow" button to move the selected records to the Selected Area.
- The Manage Filters screen will look like the one in Figure 3.1.3.
Figure 3.1.3
- 1: Include or Exclude Toggle Button: When generating the report, you can decide whether to include or exclude the selected parameters.
- Include: Select "Include" to include all specified parameters in the report generation process.
- Exclude: Selecting "Exclude" will cause the system to exclude all specified parameters from generating the report.
- 2: Clear Selection: Click the "Clear Selection" button to remove the whole selection. To remove a single record from the list, click the Remove (x) icon next to the record.
- 3: Apply: Click the "Apply" button for the selected parameters. The system will navigate you to the Location Report home screen. Click "Generate Report" to have the system generate reports based on your selection.
- 4: Save Filters: Click the "Save Filters" button to save the custom filter for future use. Section 3.1.1 Save and Manage Custom Filters explains the details.
3.1.1 Save & Manage Custom Filters
- You can also save the configured custom filters for future use.
- Click the "Save Filters" button shown in Figure 3.1.3.
- The Name pop-up will appear, as shown in Figure 3.1.1.1.
- Enter the name of the custom filter and click "OK."
Figure 3.1.1.1
- You can use the saved custom filter whenever you need it and delete it when you no longer need it. To do so, reopen the Manage Filters screen and follow the steps shown in Figure 3.1.1.2 according to your requirements.
Figure 3.1.1.2
- 1: Saved Filters Drop-Down: The saved custom filters will appear in the drop-down selection. Select the required custom filter from the list and click "Apply."
- 2: Manage Filters: You can check and manage the filters by clicking the "Manage Filters" button. When you click it, a list of saved custom filters will appear in the "Manage Saved Filters" pop-up screen.
- 3. Filter Names: The Filter Names section lists all saved custom filters. Click on a filter name to select it.
- 4: Select Filter: Use the "Select Filter" button to select any filter from the list.
- Click on the filter's name, and then click on the "Select Filter" button. The system will close the "Manage Saved Filters" pop-up screen. Next, click the "Apply" button on the "Manage Filters" screen. The system will navigate you to the Location Sales Report home screen. Click "Generate Report" to generate the report for the selected filter.
- 5. Delete: Use the "Delete" button to remove the filter no longer required from the list.
- Similarly, you can filter and set up the records for other tabs (parameters).
- To generate the report with the specific data you've selected, apply a selection or choose a saved filter, then click the "Generate Report" button.
- The system will generate the report based on your specific choice, and the selected filter details will be displayed under the "Selected Filters" label, as shown in Figure 3.1.1.3.
Figure 3.1.1.3
3.2 Sort By
The Sort By filter is valuable for corporate employees because they can access all company locations. This filter lets them view report records according to three parameters: the ascending order of the store number, the order of total retail from highest to lowest, and the profit margin from highest to lowest by three options, "Store#," "Highest Sales," and "Margin."
- Considering future possibilities, the Sort By filter is also available to store employees. However, for store employees, using this filter will not affect the organization of the report records for now.
Figure 3.2.1
3.3 Date Range & Presets
Date Range
Please follow the steps below to select the report's required date range and time interval:
- Click inside the Start Date field. The drop-down calendar will appear, as shown in Figure 3.3.1.
Figure 3.3.1
- Select the specific date and time from the drop-down calendar. Alternatively, manually enter the date in MM/DD/YYYY format.
- Click inside the End Date field and follow the same process.
- After making the appropriate selections for other filters, click on "Generate Report."
Presets
The Presets drop-down allows you to generate the report by selecting a common, specific duration/interval, such as Today, Yesterday, This Week, Last Week, etc. Please follow the steps below to choose the report's required date range using Presets.
- Hover over the "Presets" button.
- As shown in Figure 3.3.2, a drop-down menu will appear, allowing you to select the required duration or interval. The system will automatically set the Start and End Dates based on your selection.
- After making the appropriate selections for other filters, click on "Generate Report."
Figure 3.3.2
3.4 Return Filter
The Return Filter drop-down lets you sort the sales records by three parameters: All Sales, Only Returns, and Exclude Returns.
Figure 3.4.1
- Only Returns: When generating the report, choose "Only Returns" to include only item return-related records.
- Exclude Returns: When generating the report, choose "Exclude Returns" to exclude all item return-related records from the report.
The report will show the records based on your selection. However, the report format will be the same as shown in Figure 2.1.
3.5 Include In Sales Reporting
The Include In Sales Reporting drop-down allows you to filter the report records based on three parameters: All Departments, Only Include in Sales Reporting, and Not Include in Sales Reporting.
What Is "Include In Sales Reporting?"When creating or editing a Department, the corporate employee can use the "Include In Sales Reporting" feature to determine whether to include the department's sales data in the overall sales report. This feature is typically used to distinguish between items that contribute to the business's income and those that don't.
- The corporate employee creates separate departments for items that are given as complimentary (not as part of a discount or offer), are for internal use, or any other items they may not want to include in the sales report, and disables the "Include In Sales Reporting" button for those departments.

When generating the report, you or the corporate employee can view the report records based on three options: all departments, departments with the "Include In Sales Reporting" button enabled, and departments with the "Include In Sales Reporting" button disabled.
These options are available via the menu selections "All Departments," "Only Include in Sales Reporting," and "Not Include In Sales Reporting," as shown in Figure 3.5.1.
Figure 3.5.1
- All Departments: By default, the system selects this option, displaying items from all departments.
- Only Include in Sales Reporting: When you select this option to generate the report, the system will show only the items from the departments for which the "Include In Sales Reporting" button is enabled.
- Not Include In Sales Reporting: When you select this option to generate the report, the system will show only the items from the departments for which the "Include In Sales Reporting" button is disabled.
Select the option that best suits your requirements to generate the report.
The report will show the records based on your selection. However, the report format will be the same as shown in Figure 2.1.
3.6 Filter the Sales By
The Filter the Sales By drop-down lets you filter the report records based on three parameters: All Sales, E-Commerce Sales, and In Store Sales.
The Filter the Sales By drop-down has three options: "All Sales," "E-Commerce Sales," and "In Store Sales," as highlighted in Figure 3.6.1.
Figure 3.6.1
- All Sales: The system selects "All Sales" by default and shows all records, as shown in Figure 2.1.
- E-Commerce Sales: Select this option to generate the report to view the sales data only for the items sold through the E-Commerce website.
- In-Store Sales: This option generates a report displaying sales data for only the items sold in the store.
The report will show the records based on your selection. However, the report format will be the same as shown in Figure 2.1.
4. Scheduling a Report
FTx Cloud POS supports report automation, allowing you to configure and schedule a report. The system will then send the scheduled report to the designated email addresses at the specified frequency (daily, weekly, bi-weekly, monthly, quarterly, etc.).
5. Printing / Exporting a Report
You can print or export any report according to your requirements. When you use the Print function, the system creates and opens the report's PDF file in a new tab. You can download the soft copy or print the paper copy according to your requirements.
6. Manage Favorites
FTx Cloud POS provides quick access to frequently viewed reports through the "Favorite Reports" feature. You can save a report as a favorite and manage all your favorites from any report screen using the "Manage Favorites" button.
Related Articles
Crosstab Sales Report - Store Employee
Crosstab Sales Report Overview The "Crosstab Sales Report" in FTx Cloud POS summarizes and compares sales data across multiple dimensions. It lets you analyze your sales patterns by parameters such as the day of the week, hours of operation, and ...Commission Sales Report - Store Employee
Commission Sales Report Overview Sales commissions, also known as spiffs, are additional compensation provided to employees alongside their regular salary for meeting specific sales criteria. As a store owner or retailer using FTx Cloud POS, you have ...Summary Sales Report - Store Employee
Summary Sales Report Overview A "Summary Sales Report" in the FTx Cloud POS system provides a concise overview of sales activity over a selected time period. This article includes information about: How to generate the "Summary Sales Report" for the ...Brand Sales Report - Store Employee
Brand Sales Report Overview The "Brand Sales Report" displays all sales for the brand within a specified time frame. A brand sales report is essential for analyzing a brand's performance within a company. It’s a strategic tool for understanding, ...Manufacturer Sales Report - Store Employee
Manufacturer Sales Report Overview The "Manufacturer Sales Report" shows sales information for all or selected categories, manufacturers, and vendors. Various filters can be configured to make the report more specific. This article includes ...