Purchase Analysis Report
Purchase Analysis Report Overview
Reports -> Inventory Reports -> "Purchase Analysis Report"
Inventory management will always be critical for retailers. Inventory reports will help you to track available items, out-of-stock items, item returns, purchase details, invoice details, and many other useful reports of the inventory.
FTx Cloud POS includes the "Purchase Analysis Report" that allows you to check the purchased items between specific date ranges, selecting specific parameters [UPC, vendors, etc.] and other filter options. An employee/super-admin can easily analyze and check the previously purchased item data using different report types.
In this technical document, you will see:
- How to check the purchase analysis report using different types of given report types- How to apply the custom filter options to filter the purchased data as well as filtering item returns- Grouping options to get the purchased data in a specific manner
1. Reaching the "Purchase Analysis Report"
To reach the "Purchase Analysis Report," follow the below steps:
- Step 1: Log into Control Center
- Step 2: Choose Point of Sale
- Step 3: Choose Reports
- Step 4: Choose Inventory Reports
- Step 5: Choose Purchase Analysis
See Figure 1.1. You will see many types of inventory reports that will be useful to your retail business. By clicking the "Choose Report" drop-down menu, you will see the different types of inventory reports.
Figure 1.1
2. Understanding the "Purchase Analysis Report"
You will see the "Report Data is Empty" message initially. You need to select the filter options to check the Purchase Analysis Report. See Figure 2.1.
Figure 2.1
You will see the "Report data is empty" message initially. You need to select at least one location or location group to get the Purchase Analysis Report by entering the days that have been counted since.
3. Generating the "Purchase Analysis Report"
When you navigate to the "Purchase Analysis Report" page, you will get the options pre-selected by default. You will see the Report Type drop-down selection to generate the purchase report with specific data.
Figure 3.1
You can generate the purchase analysis report by selecting one report type from the drop-down selection:
- Purchase Analysis Summary
- Purchase Analysis Details
- Department Item Summary
- Item Breakdown by UPC
3.1 Purchase Analysis Summary
By selecting "Purchase Analysis Summary," you will get the department-wise purchase analysis data between the specific dates. By generating the report, you can see on which date the store purchased the items from which vendor.
Figure 3.1.1
Understand the following details (column data) that are shown in the tabular format:
- Store: It displays the name of the store from which the product was purchased.
- Vendor: It displays the vendor who sold the products to the store.
- Date: It displays the date when the product was supplied.
- Invoice #: It displays the invoice number.
- Qty: It displays the quantity of the products supplied by the vendor.
- Cost: It displays the applicable cost of the product.
- Retail: It displays the applicable retail price.
- Profit: It displays the profit in dollar amount ($).
3.2 Purchase Analysis Details
By selecting the "Purchase Analysis Details" type, you will get the department-wise Purchase Analysis Report with the product name and UPC details.
Figure 3.2.1
When you generate the "Purchase Analysis Report," all the report data will be similar to the "Purchase Analysis Summary Report," but the Item Name and UPC columns will be additionally visible.
3.3 Department Item Summary
By selecting the "Department Item Summary" type, you will get only the department-specific item details that were purchased within the selected date range.
Figure 3.3.1
By generating the report, you will see the data of the inventory that was purchased between the specific date
range.
3.4 Item Breakdown By UPC:
The "Item Breakdown by UPC Report" provides a detailed view of product purchases by UPC, showing quantity, cost, retail, and profit. It helps track item-level trends, identify popular or slow-moving products, and analyze profitability.
Figure 3.4.1
This detailed view helps make better decisions about inventory and working with vendors.
4. Filter Options
Let's see how to filter the data to generate the desired purchase analysis data in the report.
4.1 Custom Filter
You will see the Filter By drop-down option, from which you can select the specific data for the purchase analysis report. You will find the two options from the Filter Items drop-down selection:
Figure 4.1
- By clicking the "Manage" button, a "Manage Filters" window will pop up. You will see the following details:
Figure 4.1.1
Manage Filter screen information:
- Manage Filters Drop-down: Select the saved custom filters from the Manage Filters drop-down (if any) and click "Apply" to apply the saved custom filter. The system will redirect you to the Purchase Analysis Report home screen. Click "Generate Report" to generate the report for the selected filter. Clicking the "Manage Filters" button will also open the list of saved custom filters.
- Parameter Tabs: You will see eight tabs: UPC, Department, Manufacturer, Category, Tag, Buydown, Vendor, and Department Tag. Select the required tab, i.e., UPC, to create or apply a custom filter specific to the selected UPCs.
- Search: Use this Search box for a specific result.
- All Items: Use this drop-down to filter the Manage Filter screen data based on four parameters: All Items, Child Only, Parent Only, and Standalone only.
- Active Only: Use this drop-down to filter the Manage Filter screen data based on three parameters: Active Only, Inactive Only, and All Records.
- Match All Filters drop-down: Use the Match All Filters filter to decide whether or not the Manage Filter screen data matches all applied filters.
- Results: Here, you see the relevant list of data for the selected tab. For example, if you have chosen the UPC tab, it will show the list of all UPCs. You can search for a specific UPC in the Search bar.
- Checkboxes: Select the required products by checking the appropriate checkboxes.
- Arrow: Click the green Arrow button to move the selected records to the Selected List area.
Figure 4.1.2
1. When generating the report, you can decide whether to include or exclude the selected parameters.
- Include: If you select "Include," the system will include all the specified parameters to generate the report.
- Exclude: If you select "Exclude," the system will exclude all the specified parameters to generate the report.
2. Click the "Clear Selection" button to remove the whole selection. To remove any record from the list, click the Remove (x) icon.3. Apply or save the custom filter:
- Apply: Click the "Apply" button for the selected parameters. The system will navigate you to the Purchase Analysis Report home screen. Click "Generate Report." The system will generate reports based on your selection.
- Save Filters: Click the "Save Filters" button to save the custom filter for future use. 4.1.1 Save and Manage Custom Filters explains the details.
- Close: Use this button to exit the Manage Filters screen.
4.1.1 Save & Manage Custom Filters
- You can also save the configured custom filters for future use. By clicking the "Save Filters" button, a pop-up will appear to allow you to enter the name of the custom filter.
- Enter the name of the custom filter and click the "OK" button to save it.
Figure 4.1.1.1
- Manage Saved Filters:
The saved custom filters will appear in the drop-down selection. You can select the required custom filter from the list for the Purchase Analysis Report.Figure 4.1.1.2
You can check and manage the filters by clicking the "Manage Filters" button. By clicking on it, you will see the listing of the saved custom filters in a pop-up.
- Select Filter: Select any filter from the list to generate the desired purchase analysis report. Select the filter from the list, and then click on the "Select Filter" button.
- Delete: Delete any filter from the list that is no longer required. Select the filter and then click on the "Delete" button.
- In this way, the "Custom Filter" options (tabs) help to customize the records and set up the options to get only the required data to check the purchased data in the Purchase Analysis Report.
- Similarly, you can filter and set up the records for other tabs (parameters).
Once you have selected the records (from the custom filter) or selected the saved customer filter, you will see the Selected Filters (All) section. By generating the report, you will get the purchase analysis data as per the selected customer filter records based on the Report Type and date range selection.
Figure 4.1.1.3
4.2 Return Filter
You can filter and check the return data from the Purchase Analysis Report to see if any returns to the vendor occurred in the past.Figure 4.2.1
- Only Returns: If you select "Only Returns" and generate the report, you can see only the returned item data to the vendor.
Figure 4.2.2
- Exclude Returns: If you select "Exclude Returns" and generate the report, you can see only the purchased item invoice data in the purchase analysis report.
 Note: You can see the purchased data in the report as per the "Report Type" selection.
4.3 Date Range
You can filter your purchase analysis date in the report by selecting the date range as well as the specific time.
By clicking the edit box, you will get the tiny calendar to select the specific date range. You can also enter the date manually in mm/dd/yyyy format.
- Start Date: The start date will let you choose the start date of the selected date range.
Figure 4.3.1
- End Date: The start date will let you choose the end date of the selected date range.Figure 4.3.2
- Presets: The "Presets" label is provided to select the specific duration/interval to generate the purchased data in the report. If you want the purchased data in the report with a specific time duration (till morning/evening), you can select the particular time (hour and minutes) from the date selection.
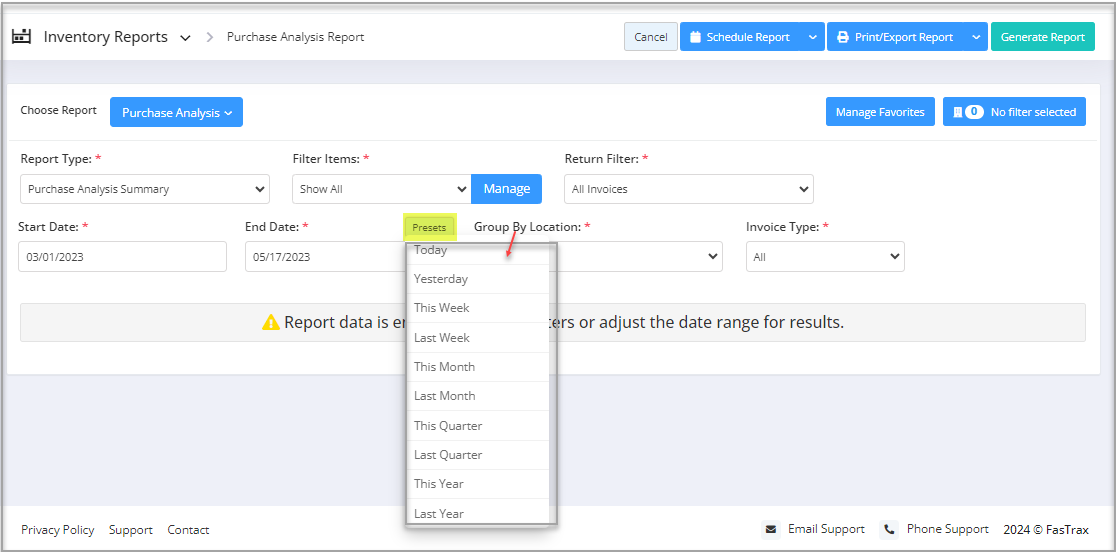 Figure 4.3.3
4.4 Group by Location
Let's see how to check the purchased data by grouping it into Locations or Location Groups.
 The Location Groups are the collection of locations and can be created from "Manage Location Groups" from POS -> Maintenance -> Locations.
 You will see a Group By Location drop-down from which you can select either "Location" or "Location Group" for grouping the purchase analysis data. By default, "None" will be pre-selected, which means the purchased data will be displayed without any grouping, as shown in Figure 4.4.1.
Figure 4.4.1
- Location: If you select "Location," the purchased data will be displayed in the grouping according to the locations (stores) individually. Once the location-specific report is generated, you can check the purchased data separated as per the locations.
- Location Group: When you select "Location Group," you will get a drop-down selection of the location groups. You can see the Include Location Group(s) drop-down option to check the purchased data under the specified location group.
Figure 4.4.2
After selecting the Location Group(s) and generating the report, you can see the Location Group-specific purchased data in the grouping.
4.5 Filter Locations & Location Groups
To check the purchased data for a specific location (store) and/or location groups only, you can set up the location filter option by clicking the button (No Filter selected) on the top-right side.
Figure 4.5.1
By clicking that button, a "Manage Filters" window will pop up, from which you will see the following details:
1. You will see the two tabs: "Store" and "Location Group."2. You can select the saved custom filter from the drop-down selection. The "Manage Filters" button will open the list of the saved custom filters.3. You can see the list of stores (locations) along with the checkbox. If there are plenty of records, you can search the store by entering the text. By ticking the checkbox, the store will be selected.
Figure 4.5.2
4. By clicking the Move button (green right Arrow button), move the selected store record(s) to the right side under Selected List.
5. Selected List and Clear Selection
5. Selected List and Clear Selection
- You can see the selected store records in the "Selected List" section. It means that when you generate the report, you will get only the purchased data in the report that is in the Selected List section.
- Clear Selection: You can remove the selected record by clicking the "Close" button. You can also remove all the selections from the list by clicking the "Clear Selection" button.
6. Apply or Save Filters: After selecting the store record(s), you can directly apply the report by clicking the "Apply" button, or you can save it for future use.
-Save and Manage Location Filters
- By clicking the "Save Filters" button, a pop-up will appear to allow you to enter the name of the location filter.
Figure 4.5.3
Enter the name of the custom filter and click the "OK" button to save it.
After saving the location filter, you can see:
1. Saved Filter: The saved custom filters will appear in the drop-down selection. You can select the required custom filter from the drop-down list for the report.2. Manage Saved Filters: You can check and manage the filters by clicking the "Manage Filters" button. By clicking on it, you will see the listing of the saved custom filters in a pop-up.Figure 4.5.4
3.1. Select Filter: Select any filter from the list to generate the desired report. Select the filter from the list, and then click on the "Select Filter" button.
3.2. Delete: Delete any filter from the list that is no longer required. Select the filter and then click on the "Delete" button.
In this way, the "Location Filter" options (tabs) help customize the records to get only the store-specific data for the purchase analysis report. Similarly, you can select the location group(s) to filter the records.
- When you set up the filters for locations (stores) and location groups, you can see the selected details by hovering the mouse cursor over the Filter button.
Figure 4.5.5
 "3.4 Group By Location" will group the purchased data based on locations or location groups, whichever you have selected, while the "3.5 Locations & Location Groups" custom filter option sets up a specific record selection. The purchase analysis data will be generated in the report as per the selected locations (stores) and/or location groups only.
4.6 Invoice Type
You can filter the purchased data based on the invoice types: Standard Invoice and Adjustment Invoice.
- All: This option is selected by default, which means that when you generate the report, the purchased data will be included for both invoice types.
Figure 4.6.1
- Standard Invoice: Standard Invoices are sent by the vendors. The vendor has supplied the items based on the inventory and store details in the invoice.
Figure 4.6.2
- Adjustment Invoice: The adjustment invoices are based on the differences between the invoiced quantity and the verified quantity via the handheld device.
Figure 4.6.3
If you select the Adjustment Invoice type, the data will show the variances that occurred after verifying the items using a handheld device at the store.

Hence, you can set up multiple custom filters and select the relevant Report Type at the same time to get the purchase report with the specific data.
5. Scheduling a Report
FTx Cloud POS supports report automation. You can configure a report and schedule it. The system will send the scheduled report to the indicated email IDs at the defined frequencies (daily, weekly, bi-weekly, monthly, quarterly, etc.).
6. Printing/Exporting a Report
You can print or export any report according to your requirements. When you use the Print function, the system creates and opens the report's PDF file in a new tab. You can download the soft copy or print the paper copy according to your requirements.
7. Manage Favorites
FTx Cloud POS allows quick access to the reports you need to view frequently through "Favorite Reports." You can save a report as a favorite and manage all your favorite reports from any of the report screens using the "Manage Favorites" button.
Related Articles
Purchase Analysis Report - Store Employee
Purchase Analysis Report Overview FTx Cloud POS provides the "Purchase Analysis Report" that allows you to review purchase history within a specific date range. You can apply various filters such as UPC, vendor name, and more to generate detailed ...Sales/Purchase Hybrid Analysis Report
Sales/Purchase Hybrid Analysis Report Overview The "Sales/Purchase Hybrid Analysis Report" compares sales data from a specific date range against purchasing details from the receiving module. You can filter the report by various item classifications. ...Purchase Orders
Purchase Orders Overview A Purchase Order (PO) is a process used to procure products for a store from a vendor. You can create a purchase order, specifying the vendor, quantities, and agreed prices for products. POs can only include parent items and ...Purchase Orders - Store Employee
Purchase Orders Overview A Purchase Order (PO) is a process used to procure products for a store from a vendor. You can create a purchase order, specifying the vendor, quantities, and agreed prices for products. POs can only include parent items and ...Vendor Parts List Report
Vendor Parts List Report Overview The Vendor Parts List Report offers a detailed listing of all vendor-associated parts along with their corresponding UPCs (Universal Product Codes) and other key product details. This report is a vital tool for ...