Suspended Sales Report
Suspended Sales Report Overview
This report lists all sales that were put on hold at the POS. For each suspended transaction, it displays the store where it occurred, the employee who suspended it, the exact date and time it was suspended, and the subtotal amount of the items in that suspended cart.
This allows managers to quickly review pending or incomplete transactions and take appropriate action, such as restoring the sale, following up with the employee, or clearing unused suspended carts.
1. Reaching the "Suspended Sales Report"
To reach the "Suspended Sales Report":
- Log into Control Center
- Choose Point of Sale
- Choose Sales Reports
Figure 1.1
- Choose Suspended Sales
2.Understanding the "Suspended Sales Report" Layout
See Figure 2.1. You will see many types of inventory reports that will be useful to your retail business. By clicking the "Choose Report" drop-down selection, you will see the different types of sales reports.
From the associated drop-down, select "Suspended Sales."
Figure 2.1
3. Generating the "Suspended Sales Report"
To generate the "Suspended Sales Report," follow the steps below. (See Figure 2.1 above.).
- From the Employee Sales Report page, you will see the Choose Report drop-down selection.
- By clicking the drop-down selection, you will see different types of sales reports in alphabetical order.
- Search for "Suspended Sales Report" from the list and click on it.
- Fill in the Date Range to fetch the report.
You will see the Report Data is Empty message initially. You need to select the date range to generate the report. See Figure 3.1
Figure 3.1
When you click on the "Generate Report" button in the top right corner, the Suspended Sales Report will be displayed, as highlighted in Figure 3.2.
Figure 3.2
Report Labels:
- Store Name: Displays the store/location where the sale was suspended. This helps identify which branch the suspended transaction belongs to.
- Employee: Shows the ID and name of the cashier or employee who suspended the transaction. This is useful for tracking who placed the sale on hold or for follow-up if needed.
- Suspended Date: Indicates the exact date and time when the transaction was suspended. This allows managers to review how long a sale has been on hold.
- Sub Total: Displays the subtotal amount of the items in that suspended transaction before tax or discounts. This helps quickly assess the value of the suspended carts.
3. Filter By Employee
This section allows you to choose specific employees whose suspended sales you want to view. By default, Show All is selected, but you can manually select individual employees as needed.
3.1. Manage Filter
See Figure 3.1 for the Manage Filter field and button descriptions:
Figure 3.1.1
1: Search: Use this Search box for a specific result.2: Results: Here, you see the relevant list of data on the Manage Filter screen for the selected suspended sales.3: Selection Checkboxes: Select the required Suspended Sales Groups by checking the appropriate checkboxes.4: Arrow: Click the green Arrow button to move the selected records to the Selected Area.Figure 3.1.2
Selected List:
1. Click the "Clear Selection" button to remove the whole selection. To remove any record from the list, click the Remove (x) icon.
2.1. Apply: Click the "Apply" button for the selected parameters. The system will navigate you to the Suspended Sales Report home screen. Click "Generate Report." The system will generate reports based on your selection, and the results will be displayed as highlighted in Figure 3.1.3.
2.2. Close: Use the "Close" button to close/exit the manage filter screen.
Figure 3.1.3
3.2 Date Range & Presets
The Date Range and Presets filter lets you select the report's time interval.
Please follow the steps below to select the report's required date range and time interval:
- Click inside the Start Date field. The drop-down calendar will appear, as shown in Figure 3.2.1.
- Select the specific date and time from the drop-down calendar. You can also manually enter the date in the MM/DD/YYYY format.
Figure 3.2.1
- Click inside the End Date field and follow the same process.
Figure 3.2.2
Presets: The Presets drop-down allows you to generate the report by selecting a specific duration/interval, such as Today, Yesterday, This Week, Last Week, etc.
- Please follow the steps below to choose the report's required date range using "Presets."
- Hover over the "Presets" button.
Figure 3.2.3
After making the appropriate selections for other filters, click on "Generate Report."
3.3. Group By Location
The Group By Location filter lets you view the report records segregated by Locations or Location Groups.
When you click the Group By Location drop-down, three options appear: None, By Location, and By Location Group, as Figure 3.3.1 shows.
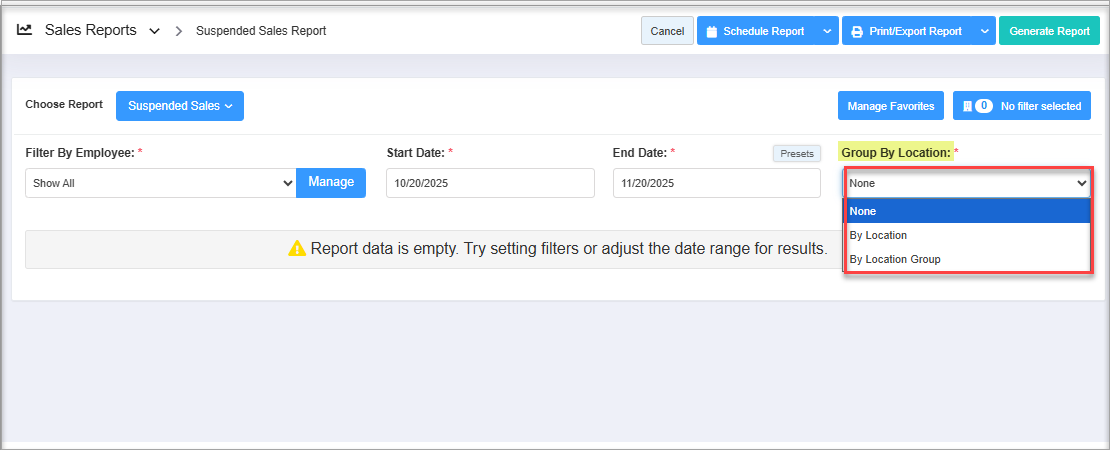
Figure 3.3.1
By default, the system selects "None." You can change it based on your requirements.
Figure 3.3.1
By default, the system selects "None." You can change it based on your requirements.
- By Locations: If you select "By Location" to generate the report, the system will display records grouped based on locations, as Figure 3.3.2 shows.
Figure 3.3.2
- By Location Groups: If you select "By Location Group" to generate the report, the system will display records grouped based on location groups, as Figure 3.2.3 shows.
Figure 3.3.3
Related Articles
Non Tax Sales Report
Non Tax Sales Report Overview The Non Tax Sales Report details all transactions where no taxes were charged. Tax regulations differ from state to state, leading to significant variability in sales tax rates within a state. FTx POS systems are ...E-Journal Report
E-Journal Report Overview E-Journals are electronically captured records of all transactions, providing a detailed log of transactional data. E-Journal Reports enable users to quickly locate and review specific transactions along with their ...Uplift Transaction Report
Uplift Transaction Report Overview The "Uplift Transaction Report" will display the list of successful uplift transactions carried out by the cashier and display the cashier's name, date/time, customer name, register, store, customer's DOB, and ...E-Journal Report - Store Employee
E-Journal Report Overview The E-Journal Report (Electronic Journal Report) is a digital record of all transactions processed on the POS terminal. It functions like a digital copy of the cash register receipt tape, capturing every action done on the ...Employee Sales Report
Employee Sales Report Overview The "Employee Sales Report" helps identify the employees who made maximum/minimum sales in the selected date range. These reports work with different types of filters that can be configured depending on the ...