Inventory Evaluation Report - Store Employee
Inventory Evaluation Report Overview
To effectively monitor product inventory, inventory reports must provide insights into available stock, total cost, and retail price. FTx Cloud POS offers a variety of inventory reports that present comprehensive details regarding stock levels, associated costs, and pricing information.
The "Inventory Evaluation Report" helps in understanding the value and status of products currently in stock. It gives a detailed snapshot of inventory by showing how much of each item is available, how much it costs the business, and its selling price. This helps businesses assess the total value of their stock at any given time.
This technical document outlines the steps to generate the "Inventory Evaluation Report," utilizing filter options and margin-based price calculations.
1. Reaching the "Inventory Evaluation Report"
To reach the "Inventory Evaluation Report," follow the steps below:
- Step 1: Log into Control Center
- Step 2: Choose Location
- Step 3: Choose Reports
- Step 4: Choose Inventory Reports
- Step 5: Choose Inventory Evaluation
You’ll find a variety of inventory reports designed to support different aspects of your retail operations. To view them, click on the "Choose Report" drop-down menu. This will display a list of available inventory report types, each offering insights for effective inventory management. See Figure 1.1. 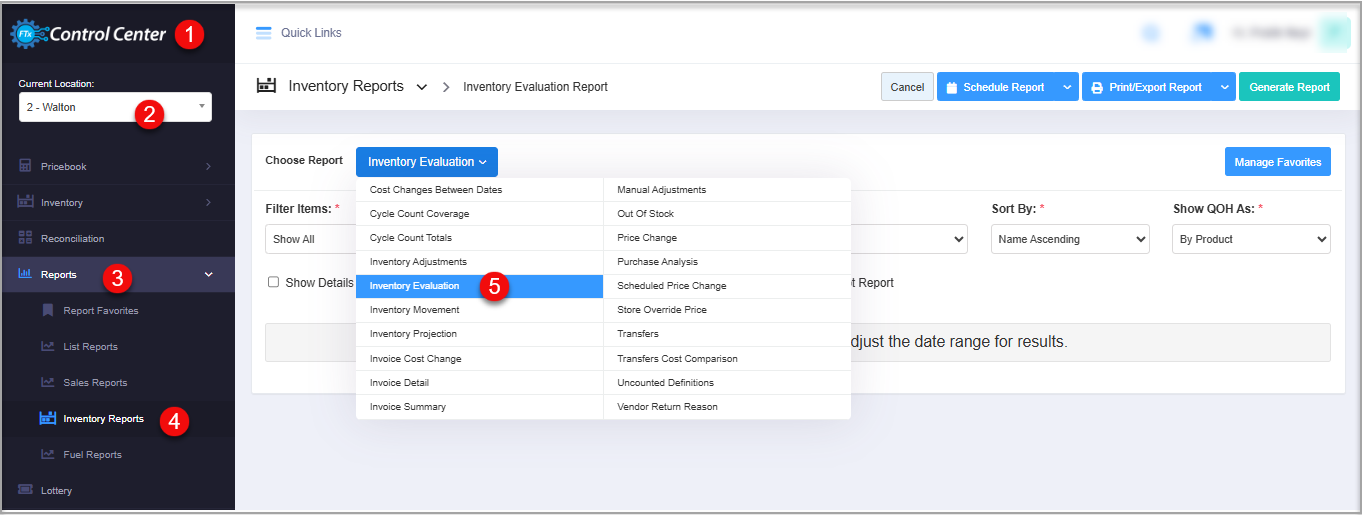 Figure 1.1
2. Understanding the "Inventory Evaluation Report" Layout
Once you click the "Inventory Evaluation," you will get the relevant filter options to customize the inventory report accordingly. You have many bifurcation options to generate the reports and check the different statistics of the inventory.
Figure 2.1
3. Generating the "Inventory Evaluation Report"
The report supports multiple filters and sorting options. Enter the required details, apply the appropriate filters, and click "Generate Report" to view the report results.
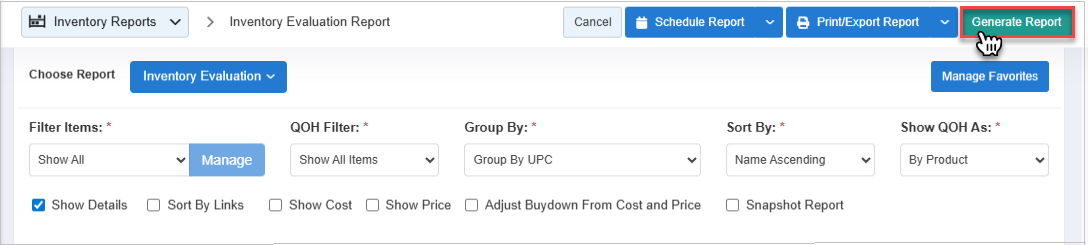
Figure 3.1
Figure 3.1
Key Information
- Customer Filters, Grouping, and Filter Options: Users can apply customer-specific filters, grouping criteria, and other filter options to customize report output.
- Inventory Evaluation Report Options: Filtering and bifurcation options are available for the Inventory Evaluation Report.

These options may vary depending on the selected report type.
To generate the report, click "Generate Report" in the top-right corner. The Inventory Evaluation Report will then be displayed on your screen (see Figure 3.2).
Figure 3.2
Upon generation, review the Inventory Evaluation Report using the default filter selections (i.e., system-defined settings without any custom filters applied). The report will display: Total Available Stock (QOH) | Total Retail Value | Total Cost | Margin ($).
Now, apply the desired filters (explained below in heading 6. Checkbox Filters) and click the "Generate Report" button to view the inventory report along with product details. Refer to Figure 3.3.
Figure 3.3
You will see the following sales data in tabular format when you generate the Inventory Evaluation Report (above in Figure 3.3):
- UPC: This represents the item's UPC that was inserted during the product creation. The UPC is scanned and sold on the register. This is the actual product sold to customers. Use the hyperlinked UPC to navigate to the Product's page.
- Product Name: This represents the name of the product.
- Vendor Part: This represents the vendor part number of the product that is received on an invoice and adds products to the store's inventory to be sold to customers.
- QOH: This represents the current stock of each product.
- Retail Each: This represents the retail price per product. Although the retail price for each product will vary as per price book zones, the highest retail price will be displayed here.
- Total Retail: This represents the total retail price of available stocks (QOH). Total Retail = QOH x (multiply) Retail Each (retail price per product).
- Cost Each: This represents the cost per product. Although the cost for each product will vary according to pricebook zones, the highest product's cost will be displayed here.
- Total Cost: This represents the total product's cost of available stocks (QOH). Total Cost = QOH x (multiply) Cost Each (retail price per product).
- Profit ($): This represents the total profit in $ amount as per the calculation between [Total Retail - (minus) Total Cost] of a product.
- Margin (%): This represents the margin that gains or loses in percentage. % Margin will calculate the margin against the Total Retail in percentage. Margin in percentage = [Profit/(divided) Total Retail] * 100.
- Grand Totals: This calculates the totals of all the available stocks for each product, including the total retail, total cost, and profit that would be earned after selling the products.
 Note: The data in the Inventory Evaluation Report is generated based on the current stocks at different stores (locations).
4. Report Filter Options
Now, let's see how to filter the items to generate the desired Inventory Evaluation Report. You will see the Filter Items drop-down option, from which you can customize the item selection.
Figure 4.1
You will find the two options from the Filter Items drop-down selection:
- Show All: It considers all the data (criteria) to generate the report. The "Manage" button will be disabled for this option. By default, this option will be pre-selected.
- Custom Filter: To customize the items for the report, you need to select the "Custom Filter" option. Once you select it, the "Manage" button will be enabled to set up the filters.
By clicking the "Manage" button, a Manage Filters window will pop up. You will see the following details: (See Figure 4.2 below.)
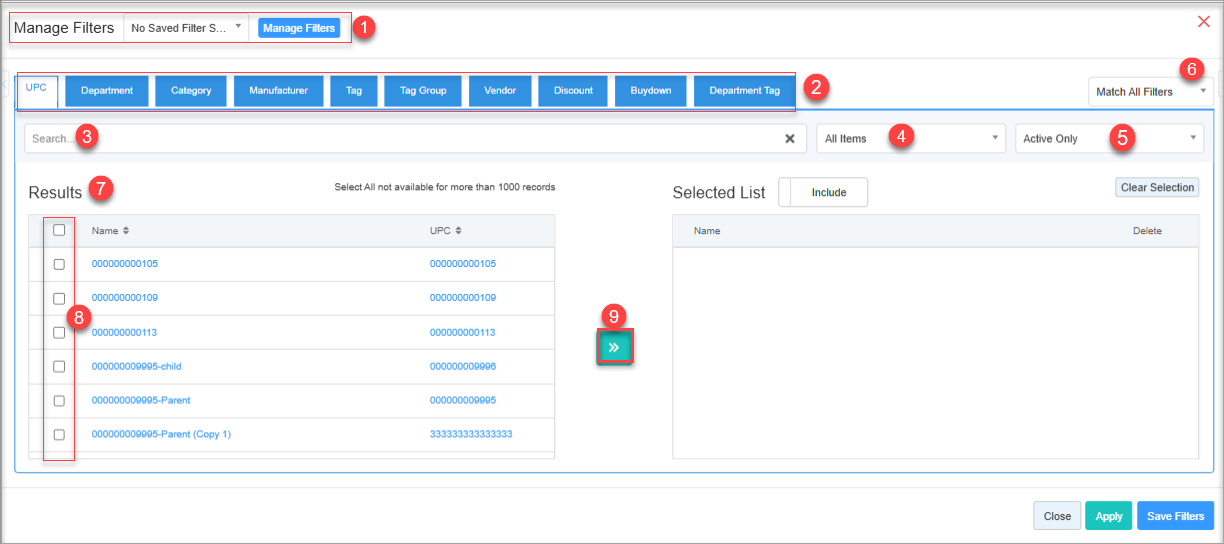
Figure 4.2
1. Manage Filters Drop-Down: Select the saved custom filters from the Manage Filters drop-down (if any) and click "Apply" to apply the saved custom filter.
- The system will redirect you to the Inventory Evaluation Report home screen.
- Click "Generate Report" to generate the report for the selected filter.
- Clicking the "Manage Filters" button will also open the list of saved custom filters.
2. Parameter Tabs: You will see the following tabs: UPC, Department, Category, Manufacturer, Tag, Tag Group, Vendor, Discount, Buydown, and Department Tag. Select the required tab, i.e., "UPC," to create or apply a custom filter specific to the selected UPCs.
3. Search: Use this Search box for a specific result.
4. All Items: Use this drop-down to filter the Manage Filter screen data based on four parameters: All Items, Child Only, Parent Only, and Standalone only.
5. Active Only: Use this drop-down to filter the Manage Filter screen data based on three parameters: Active Only, Inactive Only, and All Records.
6. Match All Filters Drop-Down: Use the Match All Filters filter to decide whether or not the Manage Filters screen data matches all applied filters.
7. Results: Here, you see the relevant list of data for the selected tab. For example, if you have chosen the "UPC" tab, it will show the list of all UPCs. You can search for a specific UPC in the Search bar.
8. Checkboxes: Select the required products by checking the appropriate checkboxes.
9. Arrow: Click the green Arrow button to move the selected records to the Selected List area.
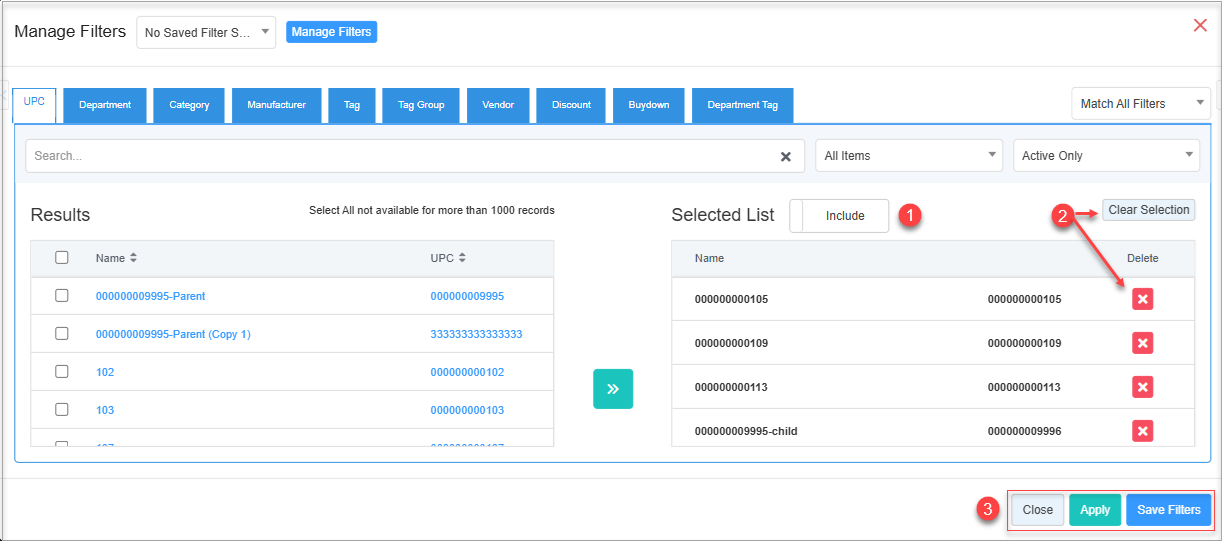
Figure 4.3
Figure 4.3
1. When generating the report, you can decide whether to include or exclude the selected parameters.
- Include: If you select "Include," the system will include all the specified parameters to generate the report.
- Exclude: If you select "Exclude," the system will exclude all the specified parameters to generate the report.
2. Click the "Clear Selection" button to remove the whole selection. To remove any record from the list, click the Remove (x) icon.
3. Apply or save the custom filter:
- Apply: Click the "Apply" button for the selected parameters. The system will navigate you to the Inventory Evaluation Report home screen. Click "Generate Report." The system will generate reports based on your selection.
- Save Filters: Click the "Save Filters" button to save the custom filter for future use. 4.1.1 Save and Manage Custom Filters explains the details.
- Close: Use this button to exit the Manage Filter screen.
4.1. Save Filters
You can also save the configured custom filters for future use. By clicking the "Save Filters" button, a pop-up will appear to allow you to enter the name of the custom filter.
Figure 4.1.1
- Enter the name of the filter to save it for future use.
Figure 4.1.2
- Once saved, click on "OK."
- The saved filter will be displayed under the "Manage Filters" button as highlighted in Figure 4.1.3.
Figure 4.1.3
- Click on "Select Filter," then click on "Apply" to apply the filter.
- Generate the report with the applied saved filter as highlighted in Figure 4.1.4.
Figure 4.1.4
4.2 QOH Filter
"QOH Filter" lets you view the items in the report with pre-defined QOH values.
Please follow the steps below to view the report records with conditional QOH values.
- Click the QOH Filter drop-down filter.
- From the list of options, select the desired filter based on Quantity On Hand (QOH) as described below.Figure 4.2.1
- As Figure 4.2.1 shows, the seven options will appear: Show All Items | Only Items > X | Only Items < X | Only Items >= X | Only Items <= X | Only Items = X | Only Item <> X
- The system selects "Show All Items" by default. X is the required quantity you specify. When you select any of the other options, the X Value field will appear, as Figure 4.2.2 shows. Enter the desired X value in it.
- For example, you choose to enter 6.
Figure 4.2.2
- Only Items > X: Selecting this option will generate a report displaying items with Quantity on Hand (QOH) values greater than the amount you specified. In this example, it will show the items that have QOH > 6.
- Only Items < X: Selecting this option will generate a report displaying items with Quantity on Hand (QOH) values less than the amount you specified. In this example, it will show the items that have QOH < 6.
- Only Items >= X: Selecting this option will generate a report displaying items with Quantity on Hand (QOH) values greater than or equal to the amount you specified. In this example, it will show the items that have QOH >= 6.
- Only Items <= X: Selecting this option will generate a report displaying items with Quantity on Hand (QOH) values less than or equal to the amount you specified. In this example, it will show the items that have QOH >= 6.
- Only Items = X: Selecting this option will generate a report displaying items with Quantity on Hand (QOH) values equal to the amount you specified. In this example, it will show the items that have QOH = 6.
- Only Items <> X: Selecting this option will generate a report displaying items with Quantity on Hand (QOH) values greater than or less than the amount you specified. In this example, it will show the items that have QOH <> 6.
- Select the desired option from the drop-down, enter the appropriate value in the X Value field, choose the required options for other fields, and click "Generate Report."
4.3 Group By
Now, let's see how to check the Inventory Evaluation Report using different grouping options.
You can check the data in the Inventory Evaluation Report by dividing the group as well. You will have the following grouping options to generate the report in a group:
UPC | Departments | Category | Manufacturer | Tag | Department/Store Totals (See Figure 4.3.1).
Figure 4.3.1
1. Group By UPC: When you generate the Inventory Evaluation Report, by default, it will be generated with the "Group By UPC" pre-selection. The report will show the UPC (item)-wise sales data.
2. Group By Departments: If you select "Group By Departments," you will see the department-wise inventory data in the report. Items in the same department will be displayed under their respective department when generating the Inventory Evaluation Report.
Figure 4.3.2
3. Group By Category: If you select "Group By Category," you will see the product's category-wise inventory data in the report. You can check the inventory data in the report at the category level. You need to select the level from the Category Depth drop-down selection. When you select "Group By Category," by default, Show All will be pre-selected.
Figure 4.3.3
- Category Depth: When you select "Group By Category,"this drop-down option will be enabled. This drop-down option lists the level (depth) of the categories. So, by selecting the specific depth, the Inventory Evaluation report will display only the inventory data under the selected depth (level).Figure 4.3.4
4. Group By Manufacturer: If you select "Group By Manufacturer," you will see the manufacturer-specific inventory data in the report.
Figure 4.3.5
 Note: If the manufacturer is not assigned to the products, the inventory data for those products will be displayed under the Not Available group.
5. Group By Tag: If you select "Group By Tag," you will get the tag-wise inventory data in the group that is entered in the product details. When you select "Group By Tag," the Specific Tag Group will be enabled. Currently, you will see "All Tag Groups" by default.
Figure 4.2.5
Therefore, the inventory data will be grouped in the report according to the tags inserted in the product details.
6. Group By Department/Store Totals: If you select "Group By Departments/Store Totals," you will see the total on-hand stocks (QOH) with Total Retail, Cost, and Margin ($) for the specific department.
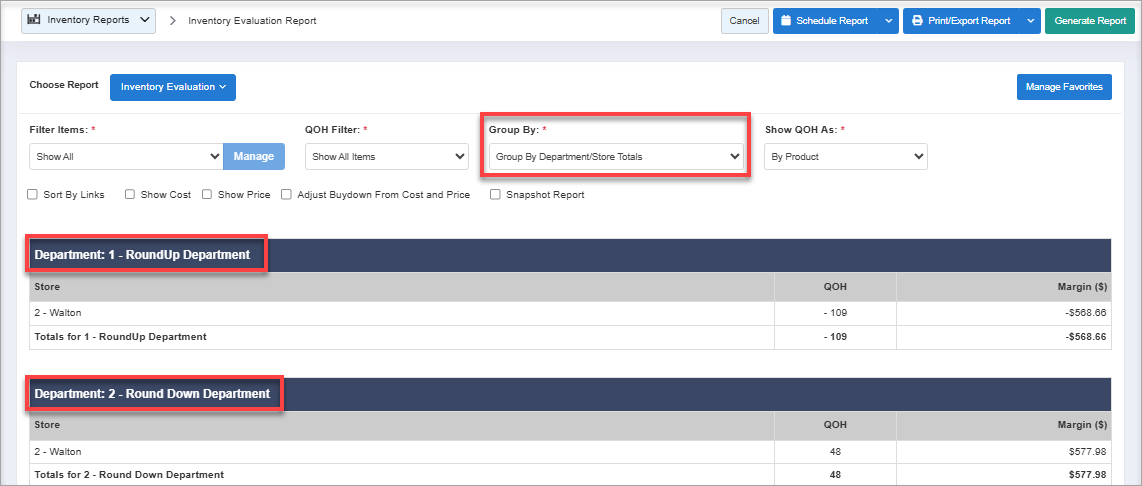
Figure 4.3.6
4.4 Sort By
The "Sort By" option in the Inventory Evaluation Report screen allows you to determine the order in which the report data will be displayed. This helps users analyze information more efficiently by organizing it based on specific criteria. The available sorting options are:
- Name Ascending: Sorts products alphabetically by name (A–Z).
- Name Descending: Sorts products in reverse alphabetical order by name (Z–A).
- UPC Ascending: Sorts products in ascending order by their Universal Product Code (UPC).
- UPC Descending: Sorts products in descending order by their Universal Product Code (UPC).
Name Ascending | Name Descending | UPC Ascending | Descending
Figure 4.4.1
Select the required option and click the "Generate Report" button to sort the report results as specified.
Select the required option and click the "Generate Report" button to sort the report results as specified.
4.5. Show QOH As
The Show QOH As filter lets you filter the report records based on three parameters: By Product, Rollup Links, and By Vendor Part. When you click the Show QOH As drop-down, the options appear, as Figure 4.5.1 shows.
By default, the system selects "By Product" and generates the report accordingly, as shown in Figure 3.1 above in section 3. Generating the Inventory Evaluation.
Figure 4.5.1
- Rollup Links: This filter will merge the related parent and child items to give you the total quantity on hand of the product in decimal format.Figure 4.5.2
- By Vendor Part: Choosing this option will display the QOH (stock available for each part) in X Part/Y Units, where "X" is the full part, and "Y" is the part num unit (subunit) in the report. The number of columns may vary as per the filters selected.
Figure 4.5.3
5. Checkbox Filters
You can enable the required options for the inventory report that are provided with the checkboxes. When you select the Inventory Evaluation Report, you will see the pre-selected filter and bifurcate options by default. You will see "Show Cost" and "Show Price" pre-selected.
Figure 5.1
5.1 Show Details
Tick the "Show Details" checkbox to display the products on the list. By ticking the "Show Details" checkbox and generating the report, you will see the products with extra details such as product name, vendor part, cost, price, etc., in the Inventory Evaluation Report.
Figure 5.1.1
You will see the Vendor Part Num, Available Stocks (QOH), Profit ($), and Margin (%) in the Inventory Evaluation Report.
5.2 Show Links
Sort By Links arranges products based on their internal link relationships, such as parent–child or related items. This ensures linked products appear together in the Inventory Evaluation Report for easier comparison.
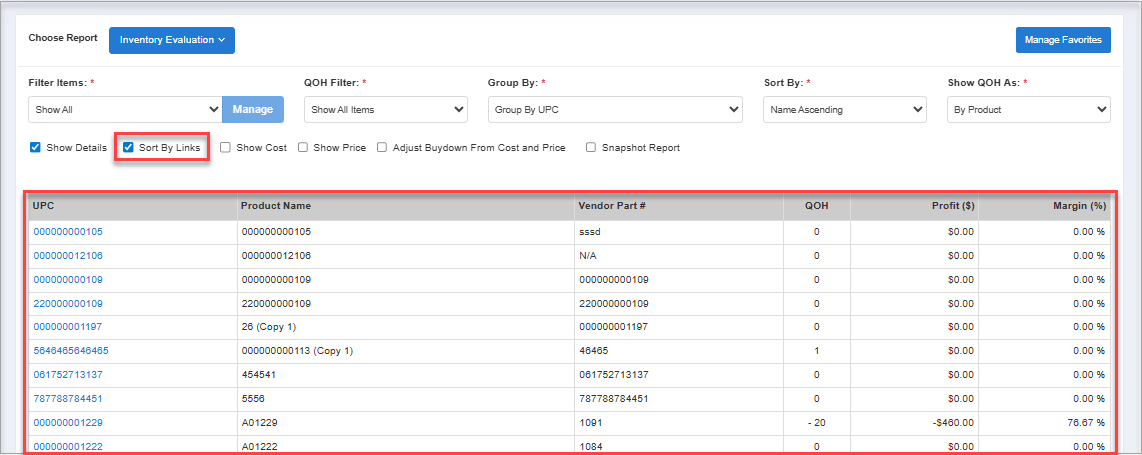
Figure 5.2.1
Figure 5.2.1
5.3. Show Cost
Tick the "Show Cost" checkbox to check the cost of each product. By ticking the "Show Cost" checkbox and generating the report, the two columns, Cost Each and Total Cost, will be displayed in the Inventory Evaluation Report.
Figure 5.3.1
The Cost Each column shows the cost of each product, and the Total Cost column shows the total cost as per available stocks (QOH) for each product.
5.4 Show Price
Tick the "Show Price" checkbox to check the retail price of each product. By ticking the "Show Price" checkbox and generating the report, the two columns, Retail Each and Total Retail, will be displayed in the Inventory Evaluation Report.
Figure 5.4.1
The Retail Each column shows the applicable retail price of each product, and the Total Retail column shows the total amount of retail price as per available stocks (QOH) for each product.
If you have selected the "Show Cost" and/or "Show Price" checkboxes only, you will see the overall Total Retail and/or Total Cost with total stocks (QOH) and Margin ($) in the Inventory Evaluation Report. 5.5 Adjust Buydown From Cost and Price
By ticking the "Adjust Buydown From Cost and Price" checkbox and generating the report, you will see the inventory data of the cost and price after applying the buydown.
- Before enabling the "Adjust Buydown From Cost and Price" checkbox, you can see the applicable cost and retail price for each product in the Inventory Evaluation Report.
Figure 5.5.1
- After enabling the "Adjust Buydown From Cost and Price" checkbox, you can see the cost and retail price after adjusting (if buydown and adjustment are applied) the buydowns in the inventory data.
Figure 5.5.2
The buydown is adjusted as per configuration from Pricebook -> Discounts/Buydowns -> Buydowns.
5.5 Snapshot Report
- By ticking the "Snapshot Report" checkbox, you can check the inventory QOH details for a specific date. Once you tick the "Snapshot Report" checkbox, the date selection will be visible.
- Select the date and generate the report to check the inventory-QOH details for that specific date.
Figure 5.5.1
Once the report is generated, you can see the snapshot report data as per the selection of the other filters and checkboxes.
6. Scheduling a Report
FTx Cloud POS supports report automation. You can configure a report and schedule it. The system will send the scheduled report to the indicated email addresses at the defined frequencies (daily, weekly, bi-weekly, monthly, quarterly, etc.).
7. Printing/Exporting a Report
You can print or export any report according to your requirements. When you use the Print function, the system creates and opens the report's PDF file in a new tab. You can download the soft copy or print the paper copy according to your requirements.
8. Manage Favorites
FTx Cloud POS allows quick access to the reports you need to view frequently through "Favorite Reports." You can save a report as a favorite and manage all your favorite reports from any of the report screens using the "Manage Favorites" button.
Related Articles
Purchase Orders - Store Employee
Purchase Orders Overview A Purchase Order (PO) is a process used to procure products for a store from a vendor. You can create a purchase order, specifying the vendor, quantities, and agreed prices for products. POs can only include parent items and ...Inventory Adjustments Report - Store Employee
Inventory Adjustments Report Overview The Inventory Adjustments Report offers a comprehensive overview of all inventory changes made within a specified date range, enabling users to monitor and verify adjustments for accuracy and transparency. It ...Inventory Movement Report - Store Employee
Inventory Movement Report Overview Inventory Movement refers to tracking the physical transfer of products — whether it's receiving stock from a vendor or transferring items between store locations. For example, when your company receives products ...Inventory Projection Report - Store Employee
Inventory Projection Report Overview Inventory Projection, also referred to as inventory forecasting or demand planning, involves analyzing past inventory data and trends to make informed decisions for future inventory management. This report type ...Sales / Inventory / Non-Sellers Report - Store Employee
Sales / Inventory / Non-Sellers Report Overview The Sales/Inventory/Non-Sellers Report provides detailed information on sales and inventory for products that have not been selling. This report consolidates hybrid data (sales, inventory, and ...