Inventory Adjustments Report - Store Employee
Inventory Adjustments Report Overview
The Inventory Adjustments Report offers a comprehensive overview of all inventory changes made within a specified date range, enabling users to monitor and verify adjustments for accuracy and transparency. It captures essential information such as product name, UPC, adjustment type, quantity, date, time, and the store where the adjustment was applied.
This article explains the purpose of the "Inventory Adjustments Report," the type of data it includes, and how to use filters to tailor the results to your needs.
This article explains the purpose of the "Inventory Adjustments Report," the type of data it includes, and how to use filters to tailor the results to your needs.
You can apply filters like Adjustment and Transfer Type to narrow down the results based on specific criteria. This report is a valuable tool for identifying inventory changes and ensuring adherence to inventory control procedures.
1. Reaching the "Inventory Adjustments Report"
To reach the "Inventory Adjustments Report," follow the steps below (See Figure 1.1):
- Step 1: Log into Control Center
- Step 2: Choose Location
- Step 3: Choose Reports
- Step 4: Choose Inventory Reports
- Step 5: Choose Inventory Adjustments
You’ll find a variety of inventory reports designed to support different aspects of your retail operations. To view them, click on the "Choose Report" drop-down menu. This will display a list of available inventory report types, each offering insights for effective inventory management. See Figure 1.1.
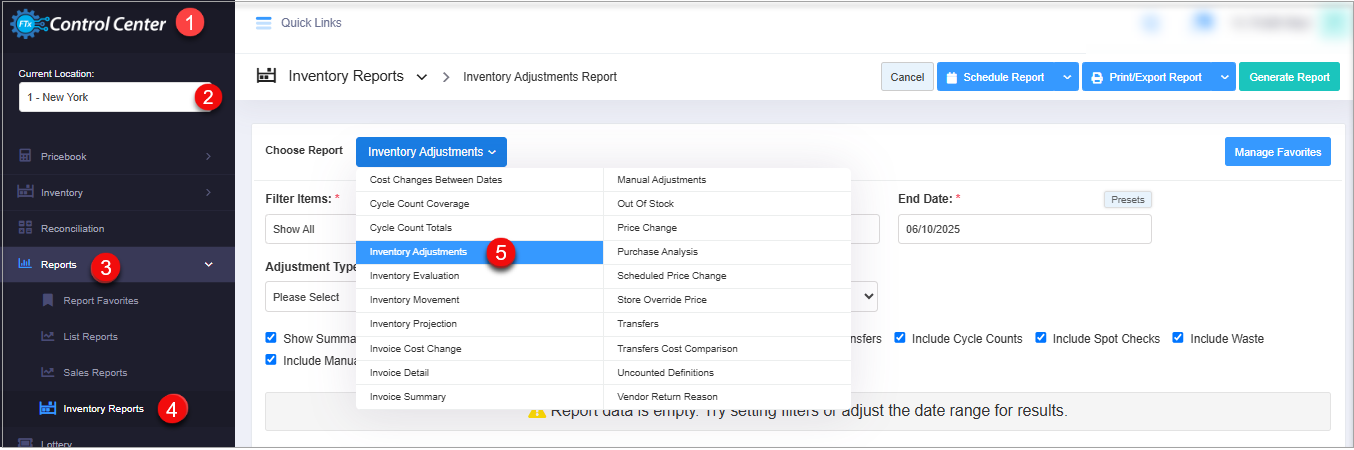
Figure 1.1
2. Understanding the "Inventory Adjustments Report"
By clicking "Inventory Adjustments," you will be redirected to the "Inventory Adjustments Report," where you can see relevant filtering and sorting options.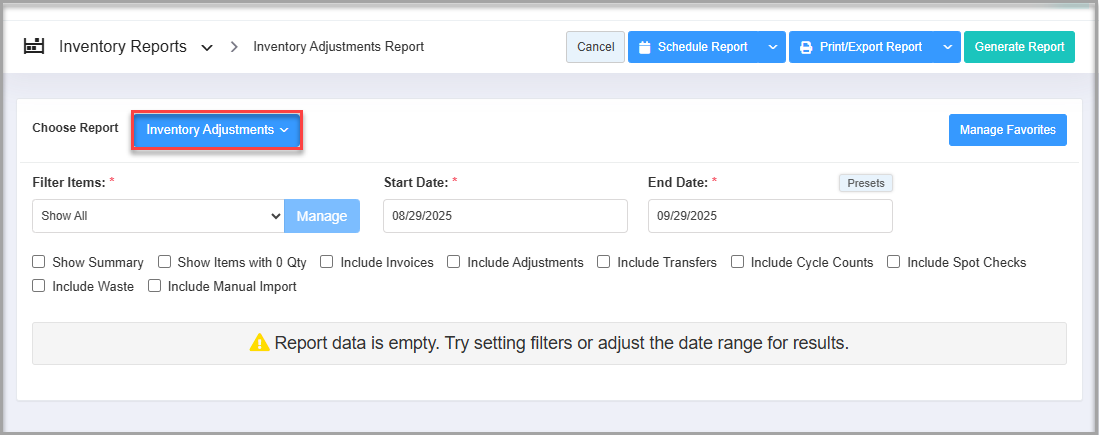 Figure 2.1
3. Generating the "Inventory Adjustments Report"
To generate the "Inventory Adjustments Report," follow the steps below. (See Figure 2.1 above).
- From the Inventory Adjustments Report page, you will see the "Choose Report" drop-down selection.
- By clicking the drop-down selection, you will see different types of inventory reports in alphabetical order.
- Search for "Inventory Adjustments Report" from the list and click on it.
The following data gets fetched in tabular format when you click on the "Generate Report" button in the top right corner; the Inventory Adjustments Report will be displayed as highlighted in Figure 3.1.
Enter the data in the fields to get desired results.
- Filter Items: This field lets you pick either of the two options, "Show All" or "Custom Filter" which are subject to displaying all the inventory adjustments for the selected location. Custom Filters will segregate the report according to different filters.
- Start Date: Pick the start date for the transfer time period.
- End Date: Pick the end date for the transfer time period.
- Checkbox Filters: Tick the desired filter to get a more detailed report.
Figure 3.1
The following data gets displayed in tabular format to know what items are adjusted in the selected time period.
- UPC: This is the Universal Product Code, a unique identifier for each product.
- Item Name: The name of the item/product involved in the inventory movement.
- Users/Employees: The person (employee or system user) who performed the action, such as an adjustment or transfer.
- Purchase Qty and Purchase Cost: These show how many units of the item were purchased and what the total cost was.
- Adjustment Quantity and Adjustment Cost: These reflect manual changes made to the inventory, such as adding or removing stock. The cost reflects the value of the adjusted quantity.
- Transfer Quantity: This refers to the number of units of a product that have been transferred from one location (store/warehouse) to another.
- Transfer From Cost: This is the cost value of the item at the originating location (the store or warehouse from where the item was sent).
- Transfer To Cost: This is the cost value of the item at the destination location (the store or warehouse receiving the item).
- Cycle Count Quantity and Cost: This shows results from scheduled inventory counts. Any discrepancies found are recorded here with their cost impact.
- Spot Check Quantity and Cost: These are from unplanned or random inventory checks. Again, any variations are captured in both quantity and cost terms.
- Import Quantity and Cost: If inventory was imported into the system via a manual or bulk upload, this shows how many units were added and their value.
- Waste Quantity and Cost: This indicates the amount of inventory discarded due to spoilage, expiration, damage, or other reasons, along with the cost lost.
- Adjustment Type: This categorizes the nature of the adjustment—for example, shrinkage, damage, theft, etc.
- Reason: A more detailed explanation for the adjustment, such as "vendor return," “expired,” “broken in transit,” or “stock mismatch.”
4. Filter Options
Let's understand the custom filter options to generate the Inventory Adjustments Report by setting up specific criteria.
Figure 4.1
4.1 Manage Filters
- You can generate the Inventory Adjustments Report for all store locations with the "Show All" option or a customized report with "Custom Filter."
- You will see the different tabs to filter the items for the item Inventory Adjustments Report. You can choose the required filter category.
- You can select the saved custom filter from the drop-down selection.
- The "Manage Filters" button will open the list of the saved custom filters. See Figure 4.1.1.
Figure 4.1.1
- Select Filter: You can select any filter from the list to generate the desired Inventory Adjustments Report. Select the filter from the list, and then click on the "Select Filter" button.
Now, let's see how to check the Inventory Adjustments Report using different filters. The data in the Inventory Adjustments Report can be filtered into different categories as well. The filter options are:
Figure 4.1.2
Manage Filter Screen information:
Manage Filter Screen information:
- Manage Filters Drop-Down: Select the saved custom filters from the Manage Filters drop-down (if any) and click "Apply" to apply the saved custom filter. The system will redirect you to the Inventory Adjustments Report home screen. Click "Generate Report" to generate the report for the selected filter. Clicking the "Manage Filters" button will also open the list of saved custom filters.
- Parameter Tabs: You will see six tabs: Department, Category, Manufacturer, Tag, Vendor, and Department Tag. Select the required tab, i.e., "UPC," to create or apply a custom filter specific to the selected UPCs.
- Search: Use this search box for a specific result.
- Match All Filters Drop-Down: Use the Match All Filters filter to decide whether or not the Manage Filter screen data matches all applied filters.
- Results: Here, you see the relevant list of data for the selected tab. For example, if you have chosen the "UPC" tab, it will show the list of all UPCs. You can search for a specific UPC in the Search bar.
- Checkboxes: Select the required products by checking the appropriate checkboxes.
- Arrow: Click the green arrow button to move the selected records to the selected list area.
Figure 4.1.3
1. Selected List: You will have one flag to decide whether you want to "Include" or "Exclude" the selected records when Figure 4.1.3 is generated.
- Include: If the flag is selected as "Include," it means the Inventory Adjustments Report will be generated by applying the selected records.
- Exclude: If the flag is selected to "Exclude," it means the Inventory Adjustments Report will be generated without including the selected records.
2. Clear Selection: You can remove any record from the list by clicking the "Remove" (x) icon. If you want to remove the whole selection, click the "Clear Selection" button.
3. Apply or save the custom filter:
- Apply: Click the "Apply" button for the selected parameters. The system will navigate you to the Inventory Adjustments Report home screen. Click "Generate Report." The system will generate reports based on your selection.
- Save Filters: Click the "Save Filters" button to save the custom filter for future use. 4.2 Save and Manage Custom Filters explains the details.
- Close: Use this button to exit the Manage Filter screen.
4.2 Save Custom Filter
You can also save the configured custom filters for future use. By clicking the "Save Filters" button, a pop-up will appear to allow you to enter the name of the custom filter.
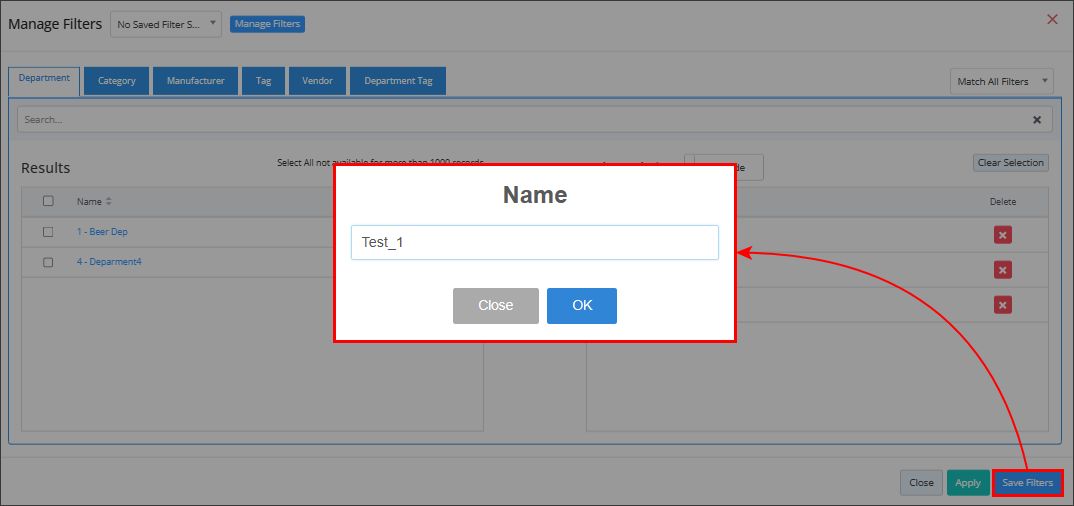
Figure 4.2.1
- Click on "OK" to save the filter; once saved, click on "Apply" to apply the filters to the report.
4.3 Date Range
You can filter your data in the report by date and select a specific time from the Start Date and End Date drop-down calendars.
By clicking the edit box, you will get the drop-down calendar to select the specific date range. You can also enter the date manually in mm/dd/yyyy format.
You can also generate a report with a specific time duration (morning/evening) and select a particular time (hour & minutes) from the date selection. See Figure 4.3.1.
- Start Date: This option lets you set the start date for the selected date range.
Figure 4.3.1
- End Date: This option lets you set the end date for the selected date range.
Figure 4.3.2
- Presets: The presets label is provided to select the specific duration/interval to generate the Inventory Adjustments Report according to the selected time period.
Figure 4.3.3
4.4 Checkbox Filters
You can also use checkbox filters to quickly select multiple filters at once, making it easier to refine and customize the report results.
1. Show Summary: This check filter will list the summary of items that have been adjusted in the selected time duration.
Figure 4.4.1
2. Show Item with 0 Qty: This filter will display the list of items whose quantity has become "0" or less than "0" at the selected store.
Figure 4.4.2
3. Include Invoices: This checkbox filter includes the list of invoices relevant to the inventory adjustment in the selected time period. 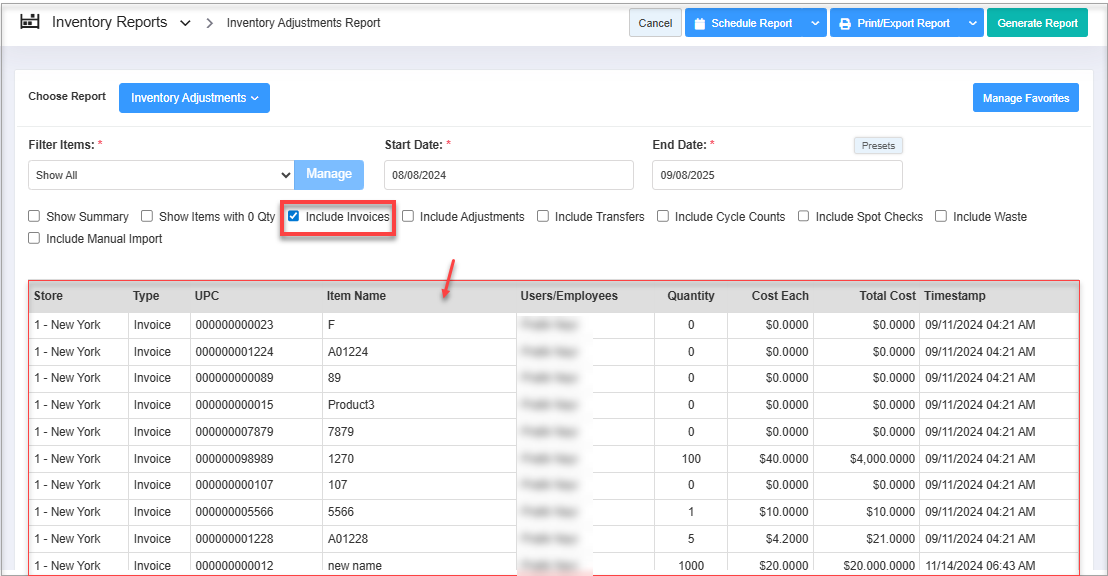
Figure 4.4.3
Figure 4.4.3
4. Include Adjustments: This checkbox filter includes the list of items adjusted in the report.
 When you check the Adjustment Filters checkbox, the Adjustment Type drop-down becomes visible. Select an adjustment type from the list to refine the results. Refer Figure 4.4.4.
Figure 4.4.4
5. Include Transfers: This checkbox filter will list transfers from the "selected stores."
When you check the Transfer Filters checkbox, the Transfer Location Filter and Transfer Type drop-downs become visible. Select a transfer type from the drop-down list or apply location filters to refine the results. Refer to Figure 4.4.5. Figure 4.4.5
6. Include Cycle Counts: Checking this filter will include the list of cycle counts that have been performed in the selected time period.
Figure 4.4.6
7. Include Spot Checks: Check this filter to prompt the system to list all the spot checks performed in the selected time period.
7. Include Spot Checks: Check this filter to prompt the system to list all the spot checks performed in the selected time period.
Figure 4.4.7
8. Include Waste: Check this checkbox to apply a filter to the report to display the list of items that have been wasted (expired) during the selected time period.
Figure 4.4.8
9. Include Manual Import: Check the Include Manual Import checkbox to apply a filter to the report, displaying a list of items that were manually imported using the Import Utility feature during the selected time period.
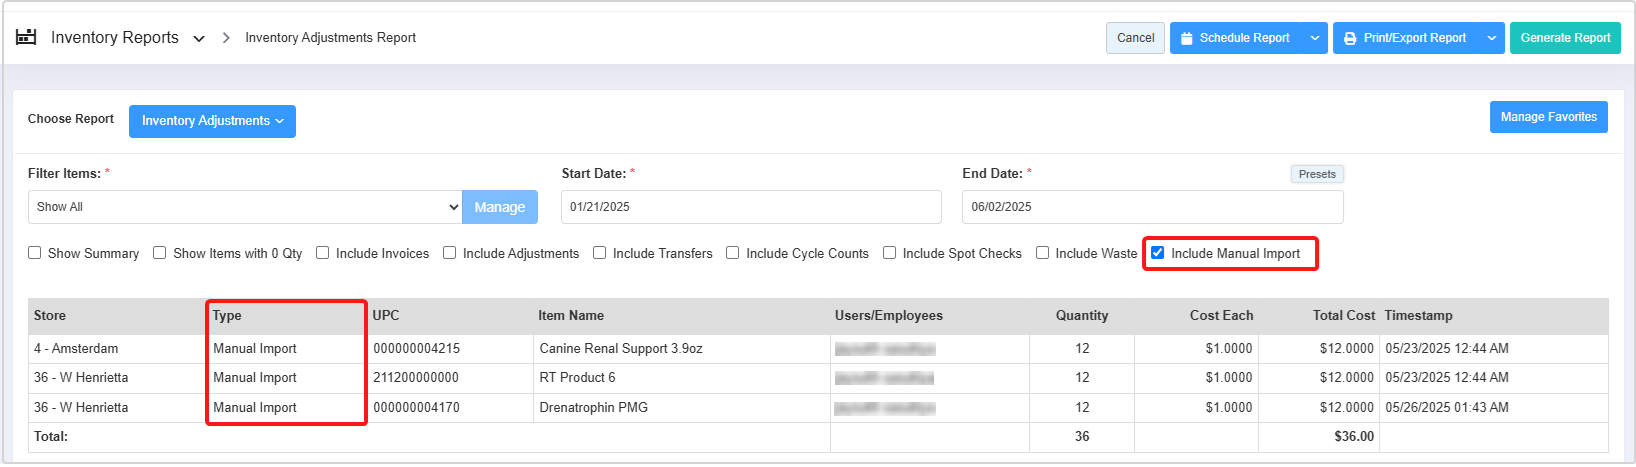
Figure 4.4.9
5. Scheduling a Report
FTx Cloud POS supports report automation. You can configure a report and schedule it. The system will send the scheduled report to the indicated email IDs at the defined frequencies (daily, weekly, bi-weekly, monthly, quarterly, etc.).
6. Printing/Exporting a Report
You can print or export any report according to your requirements. When you use the Print function, the system creates and opens the report's PDF file in a new tab. You can download the soft copy or print the paper copy according to your requirements.
7. Manage Favorites
FTx Cloud POS allows quick access to the reports you need to view frequently through "Favorite Reports." You can save a report as a favorite and manage all your favorite reports from any of the report screens using the "Manage Favorites" button.
Related Articles
Manual Adjustments Report - Store Employee
Manual Adjustments Report Overview In certain inventory-handling scenarios — such as damaged items, inventory loss, or system discrepancies — manual adjustments to the on-hand quantity may be necessary. The "Manual Adjustments Report" provides a ...Inventory Movement Report - Store Employee
Inventory Movement Report Overview Inventory Movement refers to tracking the physical transfer of products — whether it's receiving stock from a vendor or transferring items between store locations. For example, when your company receives products ...Adjustments - Store Employee
Adjustments Overview In retail business, particularly in inventory management, an adjustment refers to changes made to inventory records to reflect the actual physical stock. These adjustments can be either positive (when extra stock is found) or ...Store Override Price Report - Store Employee
Store Override Price Report Overview The "Store Override Price Report" provides a detailed list of items whose prices have been manually overridden at the point of sale (POS) within a selected store and date range. If a specific store location is ...Worksheets - Store Employee
Worksheets Overview A Return Worksheet is a feature used to manage and process product returns, ensuring that returns are tracked systematically, authorized correctly, and accurately recorded in both inventory and financial records. In FTx Cloud POS, ...