Manual Adjustments Report - Store Employee
Manual Adjustments Report Overview
In certain inventory-handling scenarios — such as damaged items, inventory loss, or system discrepancies — manual adjustments to the on-hand quantity may be necessary.
The "Manual Adjustments Report" provides a summarized view of all manual inventory adjustments within the selected date range. It includes key details such as:
- Store Name – Identifies the location where the adjustment occurred.
- Adjusted By – Displays the name of the user who performed the adjustment.
Adjustment Details — Includes:
- Number of damaged goods
- Inventory loss
- Adjustments due to system issues
- Various other adjustment types
The report displays inventory adjustment records based on the selected filter options, ensuring users see only the most relevant data.
1. Reaching the "Manual Adjustments Report"
To reach the "Manual Adjustments Report," follow the steps below: (see Figure 1.1):
- Step 1: Log into Control Center
- Step 2: Choose Location
- Step 3: Choose Reports
- Step 4: Choose Inventory Reports
- Step 5: Choose Manual Adjustments
You’ll find a variety of inventory reports designed to support different aspects of your retail operations. To view them, click on the Choose Report drop-down menu. This will display a list of available inventory report types, each offering insights for effective inventory management. See Figure 1.1.
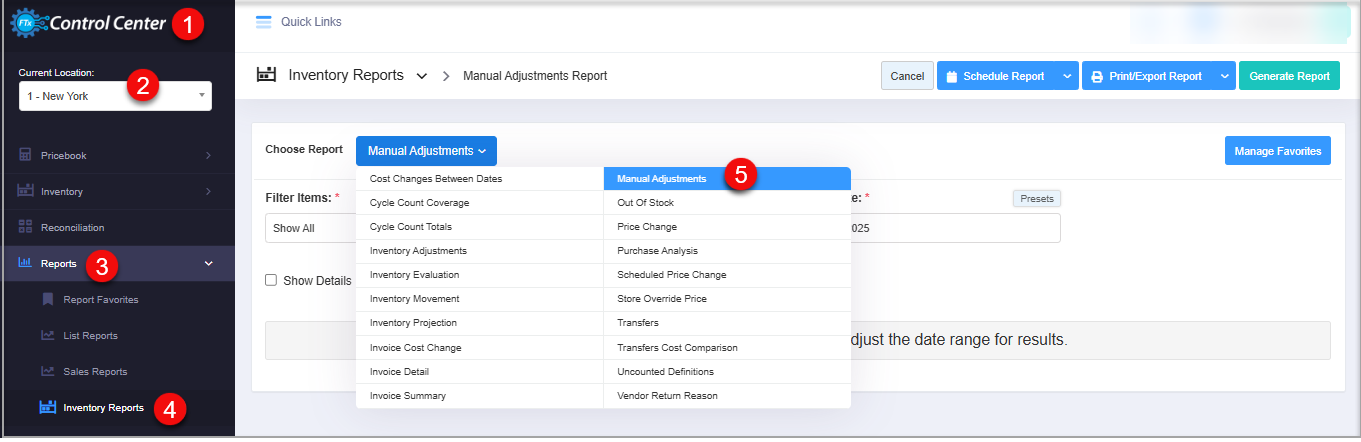
Figure 1.1
2. Understanding the "Manual Adjustments Report"
See Figure 2.1. You will see many types of inventory reports that will be useful to your retail business. By clicking the "Choose Report" drop-down menu, you will see the different types of inventory reports.
Figure 2.2
- By clicking "Manual Adjustments Report," you will be redirected to the "Manual Adjustments Report," where you can see relevant filtering and sorting options.
- From the "Manual Adjustments Report" page, you will see the "Choose Report" drop-down selection.
- By clicking the drop-down selection, you will see different types of inventory reports in alphabetical order.
- Search for "Inventory Report" from the list and click on it.
3. Generating the "Manual Adjustments Report"
To generate the "Manual Adjustments Report," follow the steps below. (See Figure 3.1 below.)
- Enter the information in the fields and click on "Generate Report."
Figure 3.1
Fields:
- Store Name: This column displays the name of the store location where the manual adjustment has been applied.
- Applied By: This column displays the name of the person who handled the manual adjustment for the adjacent store mentioned.
- Adjustment Types: It could list one of the reasons below:
- OTHER: In this column, the manual adjustment that has been created under the OTHER adjustment type for reasons other than damaged items, inventory loss, or system issues. The number mentioned in the column denotes the number of manual adjustments that were done at the particular store location in the selected date range.
- Damaged: In this column, the number of manual adjustments that have been done because the items were damaged is displayed under the Damaged column in the report.
- Inventory Lost: In this column, the number of manual adjustments where there has been some inventory loss is displayed under this column for the selected store and in the selected date range.
- Unknown Reasons: This column contains the manual adjustments that are categorized under Unknown Reason Type.
- System Issue: In this column, the manual adjustments that have been made if there has been some inventory loss are mentioned.
- Counting Error: The manual adjustments that have been done for the adjustment type — counting error — for the selected store and in the selected date range.
- Outdated Stock: The manual adjustments that were done for the adjustment type - Outdated Stock for the selected store and in the selected date range.
- Known Theft: The manual adjustments that have been done for the adjustment type -Known Theft for the selected store and in the selected date range.
3.1. Filter Options:
Let's understand the custom filter options to generate the "Manual Adjustments Report" by setting up specific criteria.
3.1.1 Save Filter and Custom Filters for the "Manual Adjustments Report"
You can generate the "Manual Adjustments Report" for all store locations with the "Show All" option or a customized report with "Custom Filter."
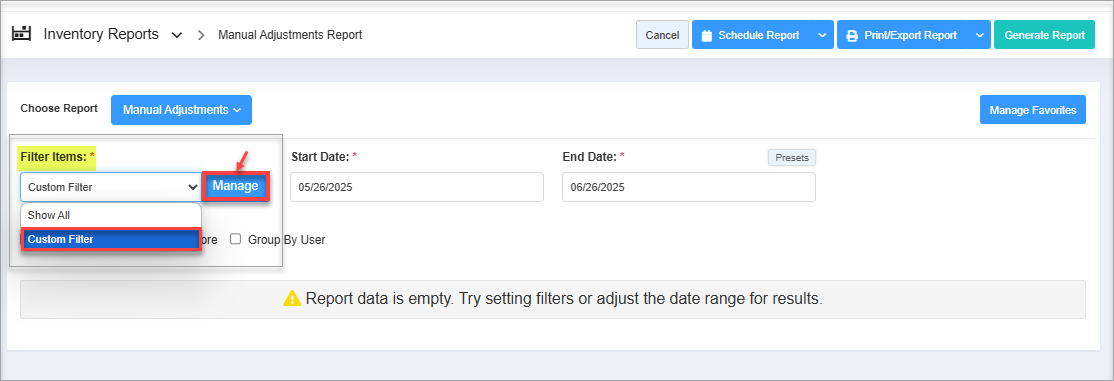
Figure 3.1.1
You will see the different tabs to filter the items for the item "Manual Adjustments Report." You can choose the required filter category.
Figure 3.1.2
Manage Filter Screen Information:
1. Manage Filters Drop-down: Select the saved custom filters from the Manage Filters drop-down (if any) and click "Apply" to apply the saved custom filter.
- The system will redirect you to the Manual Adjustments Report home screen.
- Click "Generate Report" to generate the report for the selected filter.
- Clicking the "Manage Filters" button will also open the list of saved custom filters.
2. Parameter Tabs: You will see seven tabs: UPC, Department, Category, Manufacturer, Vendor, and Department Tag. Select the required tab, i.e., "UPC," to create or apply a custom filter specific to the selected UPCs.
3. Search: Use this search box for a specific result.
4. All Items: Use this drop-down to filter the Manage Filters screen data based on four parameters: All Items, Child Only, Parent Only, and Standalone Only.
5. Active Only: Use this drop-down to filter the Manage Filters screen data based on three parameters: Active Only, Inactive Only, and All Records.
6. Match All Filters drop-down: Use the Match All Filters filter to decide whether or not the Manage Filters screen data matches all applied filters.
7. Results: Here, you see the relevant list of data for the selected tab. For example, if you have chosen the "UPC" tab, it will show the list of all UPCs. You can search for a specific UPC in the Search bar.
8. Checkboxes: Select the required products by checking the appropriate checkboxes.
9. Arrow: Click the green Arrow button to move the selected records to the Selected List area.
Figure 3.1.3
1. When generating the report, you can decide whether to include or exclude the selected parameters.
- Include: If you select "Include," the system will include all the specified parameters to generate the report.
- Exclude: If you select "Exclude," the system will exclude all the specified parameters to generate the report.
2. Click the "Clear Selection" button to remove the whole selection. To remove any record from the list, click the Remove (x) icon.
3. Apply or save the custom filter:
- Apply: Click the "Apply" button for the selected parameters. The system will navigate you to the Manual Adjustments Report home screen. Click "Generate Report." The system will generate reports based on your selection.
- Save Filters: Click the "Save Filters" button to save the custom filter for future use. 3.1.1 Save and Manage Custom Filters explains the details.
- Close: Use this button to exit the Manage Filter screen.
3.1.2 Save Filters
You can also save the configured custom filters for future use. By clicking the "Save Filters" button, a pop-up will appear to allow you to enter the name of the custom filter.
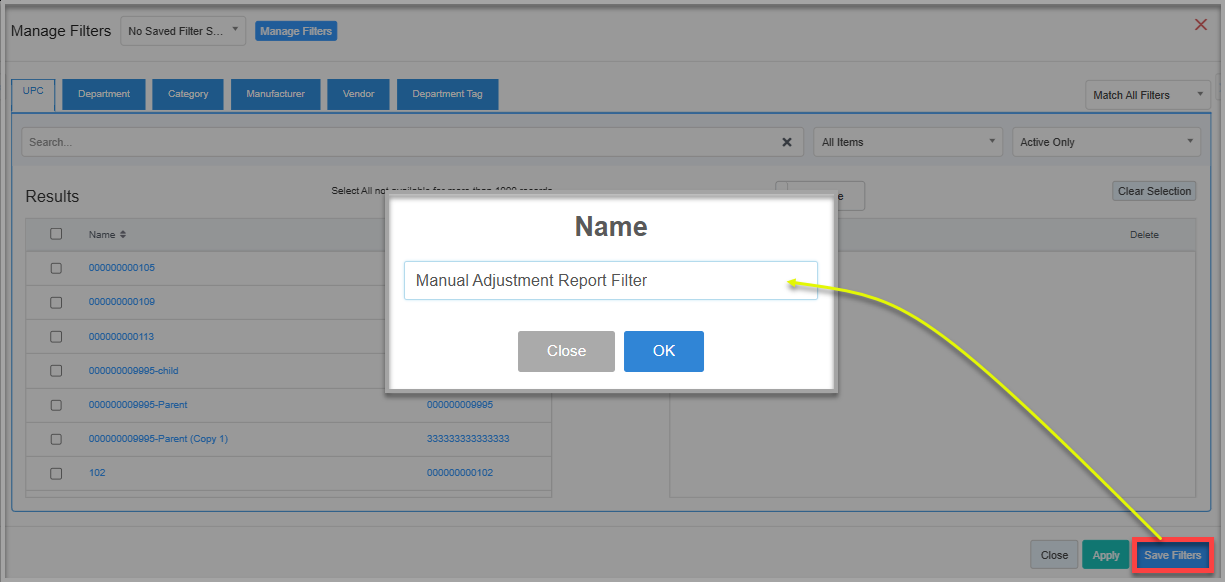
Figure 3.1.2.1
- Enter the name of the filter to save it for future use.
Figure 3.1.2.2 - Once saved, click on "OK."
- The saved filter will be displayed under the "Manage Filters" button as highlighted in Figure 3.1.2.3.
Figure 3.1.2.3
- Click on "Select Filter," then click on "Apply" to apply the filter.
- Generate the report with the applied saved filter as highlighted in Figure 3.1.2.4.
Figure 3.1.2.4
3. Date Range and Presets
You can filter your sales data in the report by selecting the date range as well as a specific time.
By clicking the edit box, you will get a tiny calendar to select the specific date range. You can also manually enter the date in mm/dd/yyyy format.
- Start Date: Use this field to set the starting date for the selected date range. Figure 3.1
- End Date: Use this field to set the ending date for the selected date range.
Figure 3.2
- Presets: This label is provided to select the specific duration/interval to generate the manual adjustments inventory data.
Figure 3.3
4. Checkbox Filter
- Show Details: This filter will display the other adjustment details that are not covered in the Manual Adjustments Report generally, such as Reason, Comment, Adjust Qty, and Adjust Amount. Figure 4.1.1
- Group By Store: This filter will group the report by store location to get a precise view of adjustments location-wise. Figure 4.2.1
- Group By User: This filter will group the report by user to get a precise view of user-specific adjustments. Figure 4.3.1
5. Scheduling a Report
FTx Cloud POS supports report automation. You can configure a report and schedule it. The system will send the scheduled report to the indicated email IDs at the defined frequencies (daily, weekly, bi-weekly, monthly, quarterly, etc.).
6. Printing/Exporting a Report
You can print or export any report according to your requirements. When you use the Print function, the system creates and opens the report's PDF file in a new tab. You can download the soft copy or print the paper copy according to your requirements.
7. Manage Favorites
FTx Cloud POS allows quick access to the reports you need to view frequently through "Favorite Reports." You can save a report as a favorite and manage all your favorite reports from any of the report screens using the "Manage Favorites" button.
Related Articles
Inventory Adjustments Report - Store Employee
Inventory Adjustments Report Overview The Inventory Adjustments Report offers a comprehensive overview of all inventory changes made within a specified date range, enabling users to monitor and verify adjustments for accuracy and transparency. It ...Time Clock Edited Entries Report - Store Employee
Time Clock Edited Entries Report Overview The "Time Clock Edited Entries Report" provides a detailed view of all time clock entries that have been manually edited by users or administrators. This includes changes such as clock-in or clock-out times ...Inventory Movement Report - Store Employee
Inventory Movement Report Overview Inventory Movement refers to tracking the physical transfer of products — whether it's receiving stock from a vendor or transferring items between store locations. For example, when your company receives products ...Adjustments - Store Employee
Adjustments Overview In retail business, particularly in inventory management, an adjustment refers to changes made to inventory records to reflect the actual physical stock. These adjustments can be either positive (when extra stock is found) or ...Manual Adjustments Report
Overview In certain inventory-handling scenarios — such as damaged items, inventory loss, or system discrepancies — manual adjustments to the on-hand quantity may be necessary. The Manual Adjustments Report provides a summarized view of all manual ...