Out Of Stock Report - Store Employee
Out Of Stock Report Overview
The Out Of Stock Report type will display the list of those products that are currently not in stock, as per the database records of the inventory management system. The system will display the records of Out of Stock products only for the specifically selected date range.
The system will also display the PLU (Price Look-Up Unit), the product name, the store name, the total quantity sold to date, and the last date of sale. This article focuses on how to generate a report of items that are out of stock as per various filters.
1. Reaching the "Out Of Stock Report"
To reach the "Out Of Stock Report," follow the steps below:
- Step 1: Log into Control Center
- Step 2: Choose Location
- Step 3: Choose Reports
- Step 4: Choose Inventory Reports
- Step 5: Choose Out of Stock
You’ll find a variety of inventory reports designed to support different aspects of your retail operations. To view them, click on the "Choose Report" drop-down menu. This will display a list of available inventory report types, each offering insights for effective inventory management. See Figure 1.1.
Figure 1.1
2. Understanding the "Out of Stock Report"
By clicking "Out Of Stock Report," you will be redirected to the "Out Of Stock Report" page, where you can see relevant filtering and sorting options.
Figure 2.1
3. Generating the "Out Of Stock Report"
To generate the "Out Of Stock Report," follow the steps below. (See Figure 2.1 above).
- From the "Inventory Report" page, you will see the "Choose Report" drop-down selection.
- By clicking the drop-down selection, you will see different types of inventory reports in alphabetical order.
- Search for "Out Of Stock Report" from the list and click on it.
The following data gets fetched in tabular format when you click on the "Generate Report" button in the top right corner; the "Out Of Stock" report will be displayed as highlighted in Figure 3.1.
Figure 3.1
The following data is in tabular format and is used to generate the report for items that are "out of stock":
- Store: This column displays the location of the store.
- PLU: PLU is the Price Look-Up Unit and is most commonly used on fresh produce items as opposed to UPC, which is usually reserved for packaged products.
- Item Name: This column displays the list of items that
are "Out of stock" and whose "QOH" (Quantity on Hand) is zero.
- Quantity Sold: This column displays the number of
quantities sold of the item (whose name and UPC are mentioned above).
- Last Sale Date: The column displays the last date of the
sale of the item.
3.1 "Out of Stock Report" Filter Options
Now, let's understand the custom filter options to generate the "Out Of Stock" report by setting up specific criteria.
You can generate the Out Of Stock Report for all store locations with the "Show All" option or a customized report with "Custom Filter."
You will find the two options from the Filter Items drop-down selection:
- Show All: It considers all the data (criteria) to generate the report. The "Manage" button will be disabled for this option. By default, this option will be pre-selected.
- Custom Filter: To customize the items for the report, you need to select the "Custom Filter" option. Once you select it, the "Manage" button will be enabled to set up the filters.
Manage Filter Screen Information:
1. Manage Filters Drop-Down: Select the saved custom filters from the Manage Filters drop-down (if any) and click "Apply" to apply the saved custom filter.
- The system will redirect you to the Out Of Stock Report home screen.
- Click "Generate Report" to generate the report for the selected filter.
- Clicking the "Manage Filters" button will also open the list of saved custom filters.
2. Parameter Tabs: You will see seven tabs: Department, Manufacturer, Category, Tag, Vendor, and Department Tag. Select the required tab, i.e., "Department," to create or apply a custom filter specific to the selected Departments.
3. Search: Use this search box for a specific result.
4. Match All Filters Drop-Down: Use the Match All Filters filter to decide whether or not the Manage Filters screen data matches all applied filters.
5. Results: Here, you see the relevant list of data for the selected tab. For example, if you have chosen the "Department" tab, it will show the list of all UPCs. You can search for a specific Department in the "Search" bar.
6. Checkboxes: Select the required products by checking the appropriate checkboxes.
7. Arrow: Click the green Arrow button to move the selected records to the Selected List area.
Figure 3.1.3
1. When generating the report, you can decide whether to include or exclude the selected parameters.
- Include: If you select "Include," the system will include all the specified parameters to generate the report.
- Exclude: If you select "Exclude," the system will exclude all the specified parameters to generate the report.
2. Click the "Clear Selection" button to remove the whole selection. To remove any record from the list, click the Remove (X) icon.
3. Apply or save the custom filter:
- Apply: Click the "Apply" button for the selected parameters. The system will navigate you to the Out Of Stock Report home screen. Click "Generate Report." The system will generate reports based on your selection.
- Save Filters: Click the "Save Filters" button to save the custom filter for future use. 3.1.2. Save and Manage Custom Filters explains the details.
- Close: Use this button to exit the Manage Filter screen.
3.1.2 Save Filters
You can also save the configured custom filters for future use. By clicking the "Save Filters" button, a pop-up will appear to allow you to enter the name of the custom filter.
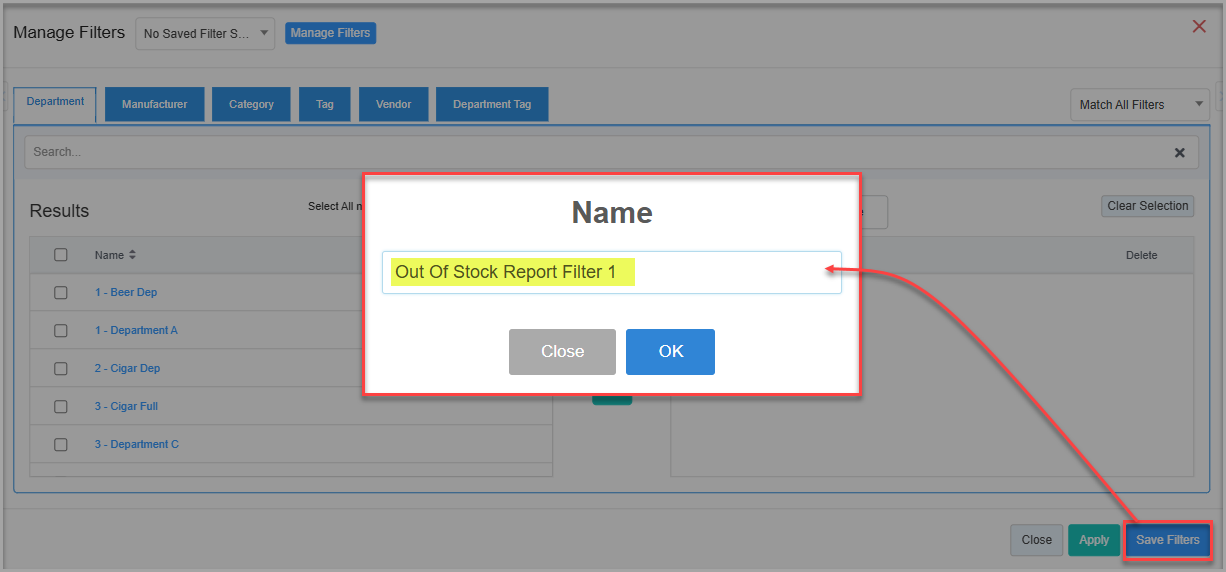
Figure 3.1.2.1
- Enter the name of the filter to save it for future use.
Figure 3.1.2.2 - Once saved, click on "OK."
- The saved filter will be displayed under the "Manage Filters" button as highlighted in Figure 3.1.2.3.
Figure 3.1.2.3
- Click on "Select Filter," then click on "Apply" to apply the filter.
- Generate the report with the applied saved filter as highlighted in Figure 3.1.2.4.
Figure 3.1.2.4
3.3 Date Range & Presets
You can filter your sales data in the report by selecting specific dates from the Start Date and End Date drop-down calendars.
By clicking the Edit box, you will get the tiny calendar to select the specific date range. You can also enter the date manually in mm/dd/yyyy format.
You can also generate a report with a specific time duration (until morning/evening); you can select the particular time (hour and minutes) from the date selection. See Figure 3.3.1, Figure 3.3.2, and Figure 3.3.3.
- Start Date: Use this field to set the starting date for the selected date range. Figure 3.3.1
- End Date: Use this field to set the starting date for the selected date range.
Figure 3.3.2
- Presets: The presets label is provided to select the specific duration/interval to generate the Out Of Stock Item Report according to the specified time period.
Figure 3.3.3
4. Checkbox Filters
These checkboxes allow users to customize the report view by adding additional item-related details. They help in enhancing report insights without altering the core data selection criteria.
- Allow Rollups: Check this filter to display the out-of-stock parent and child items' sold quantity value in decimal number format. Figure 4.2
- Show Last Reorder Date: Check this filter to display the last reorder date column for the item that is out of stock in the resultant report.
Figure 4.3
5. Scheduling a Report
FTx Cloud POS supports report automation. You can configure a report and schedule it. The system will send the scheduled report to the indicated email IDs at the defined frequencies (daily, weekly, bi-weekly, monthly, quarterly, etc.).
6. Printing/Exporting a Report
You can print or export any report according to your requirements. When you use the Print function, the system creates and opens the report's PDF file in a new tab. You can download the soft copy or print the paper copy according to your requirements.
7. Manage Favorites
FTx Cloud POS allows quick access to the reports you need to view frequently through "Favorite Reports." You can save a report as a favorite and manage all your favorite reports from any of the report screens using the "Manage Favorites" button.
Related Articles
Inventory Adjustments Report - Store Employee
Inventory Adjustments Report Overview The Inventory Adjustments Report offers a comprehensive overview of all inventory changes made within a specified date range, enabling users to monitor and verify adjustments for accuracy and transparency. It ...Top Sellers Report - Store Employee
Top Sellers Report Overview The Top Sellers Report in the FTx Cloud POS showcases the best-selling products based on sales during a specified time period. You can view this report by either the items that generated the highest revenue or those with ...Manual Adjustments Report - Store Employee
Manual Adjustments Report Overview In certain inventory-handling scenarios — such as damaged items, inventory loss, or system discrepancies — manual adjustments to the on-hand quantity may be necessary. The "Manual Adjustments Report" provides a ...Non-Sellers Report - Store Employee
Non-Sellers Report Overview The "Non-Sellers Report" in the FTx Cloud POS system identifies items or products not sold during a specific period. It helps track dead stock and underperforming products, aiding inventory control and sales planning. This ...Inventory Movement Report - Store Employee
Inventory Movement Report Overview Inventory Movement refers to tracking the physical transfer of products — whether it's receiving stock from a vendor or transferring items between store locations. For example, when your company receives products ...