Transfer Cost Comparison Report
Transfer Cost Comparison Overview
The "Transfer Cost Comparison Report" provides detailed insights into product transfers across all store locations within your company. It is designed to help you compare the cost and quantity of products moved between various locations.
You can apply multiple filters based on your specific needs. The system will then display product transfer records — showing associated costs and quantities — for each store location as per the selected filters. Transfer data is categorized by type, with separate sections showing detailed information for each.
This article explains the purpose of the "Transfer Cost Comparison Report," its key components, and how to interpret the data it presents.
1. Reaching the "Transfer Cost Comparison Report"
To reach the "Transfer Cost Comparison Report," follow the steps below:
- Step 1: Log into Control Center
- Step 2: Choose Point of Sale
- Step 3: Choose Reports
- Step 4: Choose Inventory Reports
- Step 5: Choose Transfers Cost Comparison
Figure 1.1 below will help you understand the navigation better.
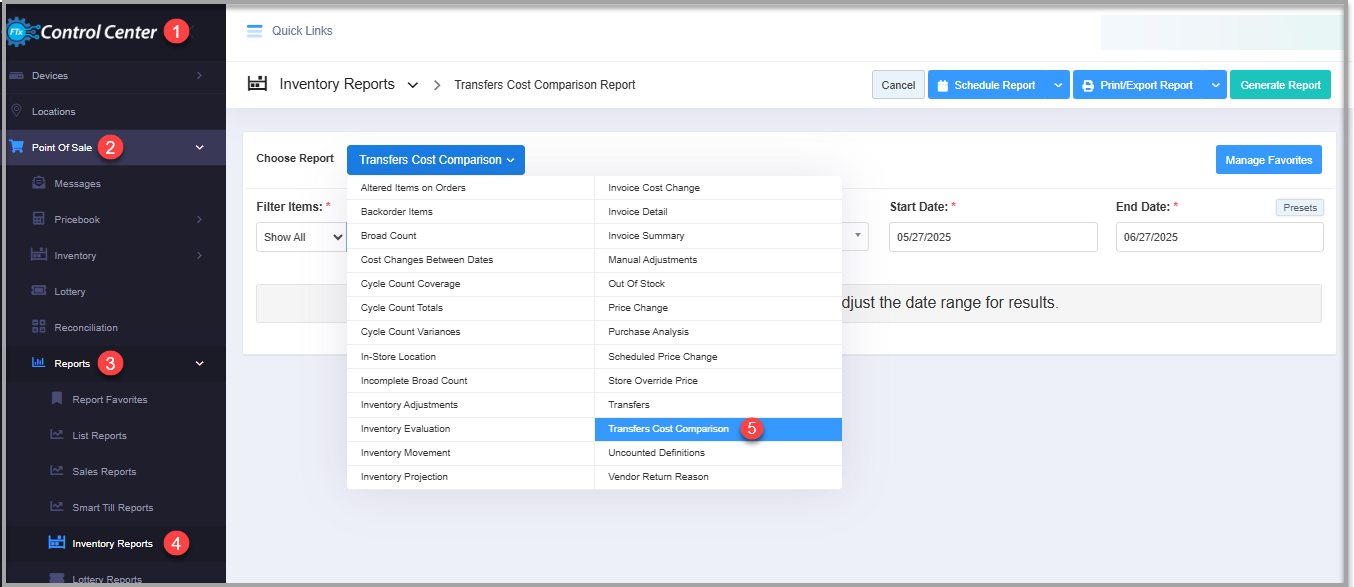
Figure 1.1
2. Understanding the "Transfer Cost Comparison Report" Layout
See Figure 2.1. You will see many types of inventory reports that will be useful to your retail businesses. By clicking the "Choose Report" drop-down selection, you will see the different types of inventory reports.
Figure 2.1
By clicking "Transfers Cost Comparison," you will be redirected to the "Transfer Cost Comparison Report," where you can see relevant filtering and sorting options.
Figure 2.2
3. Generating the "Transfer Cost Comparison Report"
To generate the "Transfer Cost Comparison Report," follow the steps below. (See Figure 2.2 above.)
- From the "Inventory Report" page, you will see the "Choose Report" drop-down selection.
- By clicking the drop-down selection, you will see different types of inventory reports in alphabetical order.
- Search for "Transfer Cost Comparison Report" from the list and click on it.
The following data gets fetched in tabular format when you click on the "Generate Report" button in the top right corner; the "Transfer Cost Comparison Report" report will be displayed as highlighted in Figure 3.1.
Figure 3.1
The following data gets displayed in tabular format to know what items are transferred to and from which store in the selected time period.
- Transfer from Store: This column of the report displays the "Transfer of Items" that has been initiated FROM the store.
- Transfer to Store: This column of the report displays the "Transfer of Items" that has been initiated TO the store.
- UPC: It stands for Universal Product Code (UPC), which helps track items at the store.
- UPC Description: This column displays the list of items that are either transferred to or from the selected store.
- Qty Transferred: Here, the total item quantity value that is transferred FROM one store TO another is mentioned.
- From Store Cost Each: This column will show the cost of each item while it is being transferred FROM the store.
- From Store Total Cost: This column will show the total cost of all the items that are being transferred FROM the store.
- To Store Cost Each: Here, the cost of each item while it is being transferred FROM the store.
- To Store Total Cost: This column will show the total cost of all the items that are being transferred TO the store.
- Cost Difference: Since the cost and price of an item can vary location-wise, cost difference will be calculated as the difference between the cost values of "From Store Cost Each" and "To Store Cost Each."
- Time Stamp: This field displays the date and time of the transfer process initiation.
3.1. "Transfer Report" Filter options
Let's understand the custom filter options to generate the "Transfer Cost Comparison Report" by setting up specific criteria.
3.1.1 Save Filter and Custom Filters for "Transfer Cost Comparison" Items
You can generate the "Transfer Cost Comparison" report for all store locations with the "Show All" option or a customized report with "Custom Filter."
Figure 3.1.1.1
You will see the different tabs to filter the items for the item "Transfer Cost Comparison Report." You can choose the required filter category.
Figure 3.1.1.2
Manage Filter Screen Information:
1. Manage Filters Drop-down: Select the saved custom filters from the Manage Filters drop-down (if any) and click "Apply" to apply the saved custom filter.
- The system will redirect you to the Transfer Cost Comparison Report home screen.
- Click "Generate Report" to generate the report for the selected filter.
- Clicking the "Manage Filters" button will also open the list of saved custom filters.
2. Parameter Tabs: You will see five tabs: Department, Manufacturer, Category, Tag, and Department Tag. Select the required tab, i.e., Department, to create or apply a custom filter specific to the selected Departments.
3. Search: Use this search box for a specific result.
4. Match All Filters drop-down: Use the Match All Filters filter to decide whether or not the Manage Filter screen data matches all applied filters.
5. Results: Here, you see the relevant list of data for the selected tab. For example, if you have chosen the "Department" tab, it will show the list of all UPCs. You can search for a specific Department in the Search bar.
6. Checkboxes: Select the required products by checking the appropriate checkboxes.
7. Arrow: Click the green Arrow button to move the selected records to the Selected List area.
Figure 3.1.3
1. When generating the report, you can decide whether to include or exclude the selected parameters.
- Include: If you select "Include," the system will include all the specified parameters to generate the report.
- Exclude: If you select "Exclude," the system will exclude all the specified parameters to generate the report.
2. Click the "Clear Selection" button to remove the whole selection. To remove any record from the list, click the Remove (X) icon.
3. Apply or save the custom filter:
- Apply: Click the "Apply" button for the selected parameters. The system will navigate you to the Transfer Cost Comparison home screen. Click "Generate Report." The system will generate reports based on your selection.
- Save Filters: Click the "Save Filters" button to save the custom filter for future use. 3.1.2. Save and Manage Custom Filters explains the details.
- Close: Use this button to exit the Manage Filter screen.
3.1.2 Save Filters
You can also save the configured custom filters for future use. By clicking the "Save Filters" button, a pop-up will appear to allow you to enter the name of the custom filter. 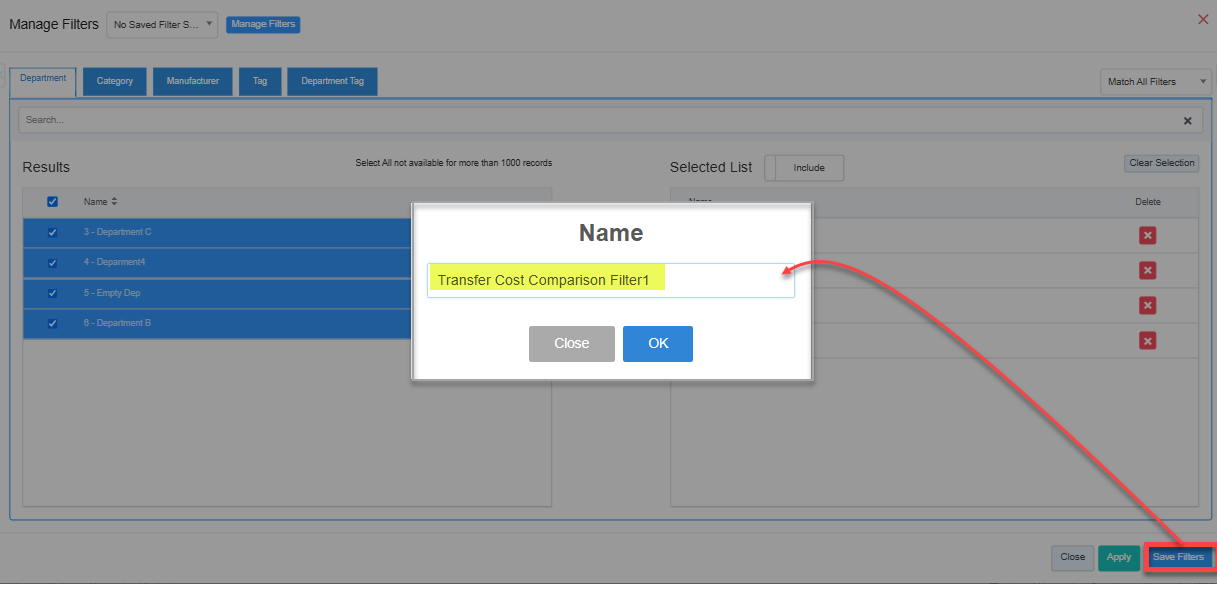 Figure 3.1.2.1
- Enter the name of the filter to save it for future use.
Figure 3.1.2.2 - Once saved, click on "OK."
- The saved filter will be displayed under the "Manage Filters" button as highlighted in Figure 3.1.2.3.
Figure 3.1.2.3
- Click on "Select Filter," then click on "Apply" to apply the filter.
- Generate the report with the applied saved filter as highlighted in Figure 3.1.2.4.
Figure 3.1.2.
3.3 Date Range
You can filter your sales data in the report between the dates and select a specific time from the Start Date and End Date drop-down calendars.
By clicking the edit box, you will get the drop-down calendar to select the specific date range. You can also enter the date manually in mm/dd/yyyy format.
You can also generate a report with a specific time duration (till morning/evening), and you can select the particular time (hour and minutes) from the date selection. See Figure 3.3.1.
- Start Date: This option allows you to choose the start date of the selected date range.
Figure 3.3.1
- End Date: This option allows you to choose the end date of the selected date range.
Figure 2.3.1
- Presets: The Presets label is provided to select the specific duration/interval to generate the Transfer Cost Comparison report according to the selected time period.
Figure 2.3.4
4. Generating the "Transfer Cost Comparison Report" After Applying Filters
Once you apply the desired filter:
- Click on "Generate Report" to generate the filtered report.
- Here you can see the selected location, "Oneonta," grouped by location.
4.1. All Transfers
4.2. "Only Transfer To" for Oneonta
The transfer data in the report is for only transfer to the "Oneonta" location.
Figure 4.2.1
4.3. "Only Transfer From" for Oneonta
The transfer data in the report is for only transfers from the "Oneonta" location.
Figure 4.3.1
5. Scheduling a Report
FTx Cloud POS supports report automation. You can configure a report and schedule it. The system will send the scheduled report to the indicated email IDs at the defined frequencies (daily, weekly, bi-weekly, monthly, quarterly, etc.).
6. Printing/Exporting a Report
You can print or export any report according to your requirements. When you use the Print function, the system creates and opens the report's PDF file in a new tab. You can download the soft copy or print the paper copy according to your requirements.
7. Manage Favorites
FTx Cloud POS allows quick access to the reports you need to view frequently through "Favorite Reports." You can save a report as a favorite and manage all your favorite reports from any of the report screens using the "Manage Favorites" button.
Related Articles
Transfer Cost Comparison Report - Store Employee
Transfer Cost Comparison Overview The "Transfer Cost Comparison Report" provides detailed insights into product transfers across all store locations within your company. It is designed to help you compare the cost and quantity of products moved ...Executive Comparison Crosstab Report
Executive Comparison Crosstab Report Overview The "Executive Comparison Crosstab Report" combines data from various areas such as sales, cycle counts, and the time clock to show an overview of a given location by weekly period. 1. Reaching the ...Sales Trend/Comparison Report
Sales Trend/Comparison Report The "Sales Trend/Comparison Report" is a compilation of multiple reports in one, showing different trends and plots based on quantity sold, dollar value sold, and profit made on items in a specific date range. It uses ...Department Sales Comparison Report
Department Sales Comparison Report Overview A "Department Sales Comparison Report" takes the sales data from two defined date ranges and provides the information. FTx Cloud POS provides the department's specific comparison sales report with custom ...Invoice Cost Change Report
Invoice Cost Change Report Overview The "Invoice Cost Change Report" will display the changes in the cost of the product(s) on an invoice. The system will display records of changes in the cost of the product(s) on an invoice only for the ...